
What is a Simple Moving Average? A Complete Guide for Forex Traders
Master simple moving average trading with our guide. Learn SMA formulas, strategies, and how to use this indicator for smarter market decisions.
A simple moving average takes the closing prices of an asset over a fixed number of periods, adds them up, and divides by that number. The result is a line on your chart that shifts forward as new data comes in. Traders use it to read trend direction, find where price tends to stall or reverse, and cut through the noise that makes short-term price action hard to follow. It runs on any market and any timeframe. Most traders who stick with technical analysis long enough end up coming back to it regardless of what else they add to their charts.
Key Takeaways
- Trend identification made easy: SMA acts as your market GPS, helping you identify whether you're in an uptrend, downtrend, or sideways market without getting lost in daily price swings.
- Support and resistance levels: These lines aren't just pretty decorations on your chart—they often act as dynamic support and resistance levels where price bounces like a basketball.
- Multiple timeframe analysis: From 20-day SMAs for short-term moves to 200-day SMAs for long-term trends, you can customize your analysis to match your trading style and timeline.
- Universal application: Whether you're trading stocks, forex, crypto, or even your grandmother's vintage teacup collection, SMAs work across all markets and timeframes.
- Foundation for advanced strategies: Master the SMA, and you've got the building blocks for more sophisticated trading systems like moving average crossovers and confluence trading.
What is Simple Moving Average (SMA)?
Let me break this down in a way that won't put you to sleep. A simple moving average (SMA) is one type of moving average that's basically the mathematical equivalent of asking your five closest friends for advice and taking the average of their opinions. Except instead of friends, we're talking about stock prices over a specific time period.
Think of it as a smoothing mechanism that cuts through market noise like a hot knife through butter. While individual price points jump around like caffeinated squirrels, the SMA gives you the big picture—the underlying trend that matters for your trading decisions.
The beauty of the simple moving average lies in its simplicity. Unlike its more complex cousins (we're looking at you, exponential moving average), the SMA treats each data point equally. No favorites, no bias—just pure, democratic averaging.
Simple Moving Average Formula: The Math Made Simple
Here's where most people's eyes glaze over, but stick with me—this is actually pretty straightforward. The simple moving average formula is so basic, you could teach it to your teenager (though they'd probably still ask you to do their homework).
SMA = (Sum of closing prices over n periods) / n
Where:
- n = number of periods you want to average
- Closing prices = the final price at the end of each period
Let's say you want a 5-day simple moving average for a stock that closed at $100, $102, $98, $105, and $103 over the last five days.
SMA = (100 + 102 + 98 + 105 + 103) / 5 = 508 / 5 = $101.60
That's it. No calculus, no advanced algorithms—just good old-fashioned addition and division.
How Do You Calculate a Simple Moving Average?
Rolling up our sleeves and getting into the nitty-gritty, calculating a simple moving average is like making a perfect cup of coffee—it's all about the right proportions and timing.
Step 1: Choose Your Time Period Are you a day trader who needs minute-by-minute updates, or a long-term investor who thinks in months? Your choice determines whether you're looking at a 10-minute SMA or a 200-day SMA.
Step 2: Gather Your Data Points Collect the closing prices for your chosen period. Most trading platforms do this automatically, but understanding the process makes you a better trader.
Step 3: Add 'Em Up Sum all the closing prices in your selected timeframe. Yes, it's that simple.
Step 4: Divide by the Number of Periods Take your total and divide by the number of data points. Voilà—you've got your SMA.
Step 5: Update Daily As new data comes in, drop the oldest price and add the newest one. The average "moves" forward with the market.
Here's a practical example using a 10-day SMA:
| Day | Closing Price | 10-Day SMA |
|---|---|---|
| 1-10 | Various prices | $50.00 |
| 11 | $52.00 | $50.20 |
| 12 | $48.00 | $49.80 |
| 13 | $55.00 | $50.50 |
Notice how the SMA changes gradually, smoothing out the daily fluctuations while reflecting the overall price direction.
Popular SMA Timeframes: Finding Your Trading Rhythm
Not all SMAs are created equal, and choosing the right timeframe is like selecting the perfect suit – it needs to fit your style and occasion. Let me break down the most popular periods and why they matter.
The 20-Day SMA: Your Short-Term Compass
The 20-day simple moving average is the millennial of technical indicators – young, responsive, and always reacting to the latest market news. It represents roughly one month of trading data and excels at catching short-term momentum shifts.
Day traders and swing traders love the 20-day SMA because it hugs price action closely without getting too caught up in daily noise. When a stock breaks above its 20-day SMA with volume, it often signals the beginning of a nice momentum run.
The 50-Day SMA: The Middle Child
If the 20-day is a hyperactive trader, the 50-day SMA is the measured analyst. It smooths out more of the short-term volatility while still remaining sensitive enough to catch meaningful trend changes. This is your Goldilocks moving average – not too fast, not too slow, but just right for many trading strategies.
Professional traders often use the 50-day SMA as a dynamic support or resistance level. When prices pull back to test this line, it often provides excellent entry opportunities for trend continuation trades.
The 200-Day SMA: The Market’s North Star
The 200-day simple moving average commands respect on Wall Street like a well-tailored Armani commands respect at a business meeting. It’s the long-term trend indicator that institutions use to separate bull markets from bear markets.
Here’s a trading truth that most people learn the hard way: when major indices trade above their 200-day SMAs, the overall market bias is bullish. When they’re below it, bears rule the playground. This single line has probably influenced more investment decisions than any economic report.
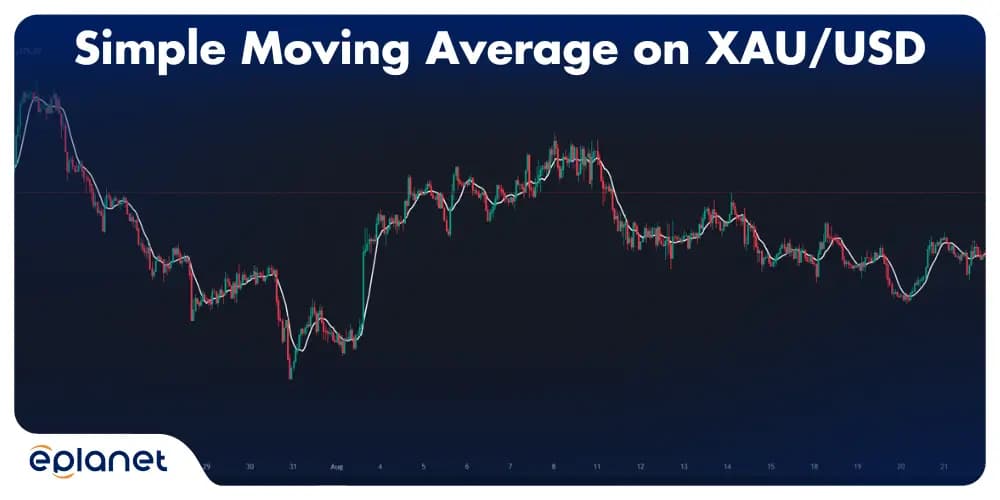
How to Use SMA on Gold (XAU/USD)
Gold does not behave like stocks or currency pairs, and that matters when you apply the SMA to it. Equities follow earnings cycles. Currency pairs move on interest rate differentials. Gold is pulled in multiple directions at once: dollar strength, inflation expectations, geopolitical pressure, and institutional order flow. That makes it more reactive at key price levels than most other instruments. SMA levels on XAU/USD tend to produce sharper reactions because more participants are watching the same levels across more sessions.
If you are new to trading gold, this actually works in your favour. You do not need to track every fundamental driver to use the SMA effectively on XAU/USD. Watch how price behaves around a key moving average across a few sessions. The reactions are consistent enough to be readable.
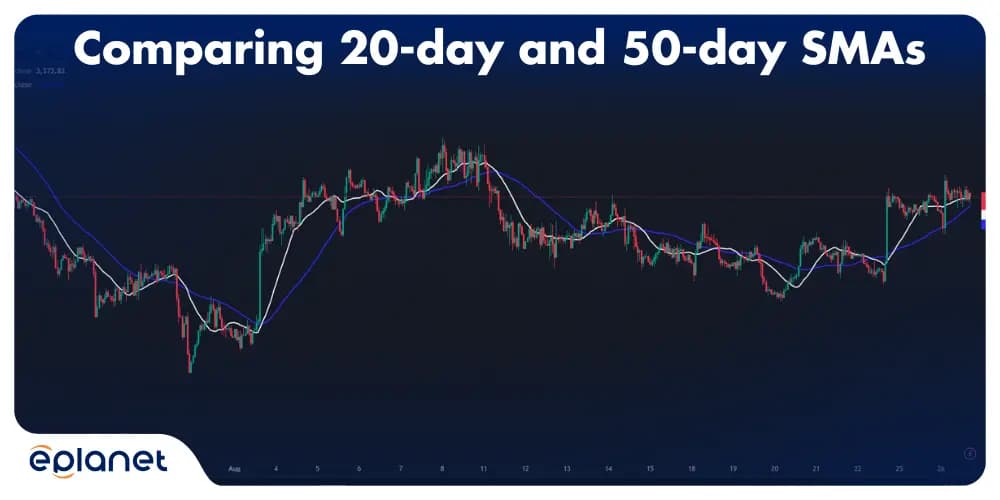
Which SMA Periods Work Best on Gold
The 50-period and 200-period SMAs on the 4-hour chart are the most widely used by active gold traders. When XAU/USD trades above the 200-period SMA on the 4-hour chart, the broader bias is bullish. Below it, sellers tend to be in control. The 50-period on the same chart sits in between and acts as a live reference during trending moves. A pullback to the 50-period SMA in an uptrend is a level many gold traders watch closely for continuation entries.
For intraday work, the 20-period SMA on the 1-hour chart is a common reference for direction within a session. On the 5-minute or 15-minute chart, the same period helps identify where price is pausing or turning on smaller moves.
Why Gold Reacts Strongly to SMA Levels
Gold trades 24 hours across London, New York, and Asian sessions. Institutional participants including central banks, hedge funds, and large commodity desks are active across all sessions. These participants use similar technical reference points, which is why round numbers and major SMA levels on gold tend to attract heavy order flow. When price approaches the 200-period SMA on the 4-hour chart, the reaction is often sharp because multiple participants are watching the same level at the same time.
This does not mean the level always holds. But it does mean something is usually happening there, and that makes it worth paying attention to.
SMA and Gold During News Events
One thing new gold traders learn quickly is that SMA levels can stop working during high-impact news releases. When the Federal Reserve makes an announcement or inflation data drops, gold can move 20 to 30 dollars in minutes. A 50-period SMA that held as support all week may not matter at all during those minutes. The price move is driven by the news, not the technical level.
The practical approach most gold traders use is to close or tighten positions before known news events rather than relying on SMA levels to protect them. The SMA is a tool for trending and ranging conditions. It is not a substitute for knowing when the market is about to shift for reasons that have nothing to do with the chart.
Simple Moving Average vs Exponential Moving Average
This is like comparing a reliable Honda Civic to a flashy sports car—both will get you where you need to go, but they handle differently.
Simple Moving Average Characteristics:
- Treats all data points equally (democracy in action)
- Slower to react to price changes
- Less prone to false signals
- Better for identifying established trends
- Ideal for beginners and conservative traders
Exponential Moving Average Characteristics:
- Gives more weight to recent prices (recency bias, but useful)
- Faster response to price movements
- More sensitive to market changes
- Can generate more trading signals (some false)
- Preferred by active traders
Think of it this way: if you're trying to determine whether your relationship is heading in the right direction, an SMA looks at the entire history equally. An EMA pays more attention to what happened last week than what happened six months ago.
| Aspect | Simple Moving Average | Exponential Moving Average |
|---|---|---|
| Calculation | Equal weight to all periods | More weight to recent data |
| Sensitivity | Lower | Higher |
| Signal Quality | Fewer false signals | More signals (some false) |
| Best For | Long-term trends | Short-term momentum |
Which is Better: EMA or SMA?
Asking whether EMA or SMA is better is like asking whether chocolate or vanilla ice cream is superior—it depends on your taste and the situation.
Choose SMA When:
- You want to identify long-term trends without getting whipsawed
- You're new to technical analysis and prefer simplicity
- You're dealing with highly volatile markets that need smoothing
- You're looking for reliable support and resistance levels
Choose EMA When:
- You need faster signals for short-term trading
- You're trading in fast-moving markets like forex or crypto
- You want to catch trend changes earlier
- You're comfortable with potentially more false signals
I've seen traders succeed with both approaches. The key isn't finding the "perfect" indicator—it's finding the one that matches your trading personality and risk tolerance.
Simple Moving Average vs Weighted Moving Average
While we're on the topic of comparisons, let's talk about the weighted moving average (WMA)—the middle child of the moving average family.
The weighted moving average assigns different weights to different periods, but unlike the EMA, you get to decide the weights. It's like having a custom-tailored suit versus buying off the rack.
SMA vs WMA Comparison:
| Feature | SMA | WMA |
|---|---|---|
| Complexity | Simple | Moderate |
| Customization | None | High |
| Speed | Slow | Medium |
| False Signals | Low | Medium |
| Best For | Beginners | Advanced users |
Most traders stick with SMA or EMA because WMAs require more setup and decision-making about weight assignments. Unless you have specific requirements, SMA and EMA will handle 95% of your trading needs.
Simple Moving Average Trading Strategy: Putting It All Together
Now we’re getting to the meat and potatoes – how to turn this technical tool into actual profits. I’ve seen traders overcomplicate SMA strategies until they’re more confused than a tourist in Times Square. Let me share the approaches that actually work in real markets.
The Golden Cross Strategy
The golden cross sounds like something from a pirate movie, but it’s actually one of the most reliable bullish signals in technical analysis. This occurs when a shorter-period SMA crosses above a longer-period SMA, typically the 50-day crossing above the 200-day.
When this happens with strong volume, it often signals the beginning of a significant uptrend. The opposite, called a death cross, occurs when the shorter SMA drops below the longer one, potentially signaling a bearish trend.
Support and Resistance Trading
SMAs don’t just identify trends – they create dynamic support and resistance levels that evolve with price action. The 20-day SMA often acts as support in uptrends and resistance in downtrends. Smart traders use these levels to time their entries and exits.
Here’s a pro tip: when a stock consistently bounces off its 50-day SMA during an uptrend, that moving average becomes a critical level to watch. A decisive break below it often signals the end of the party.
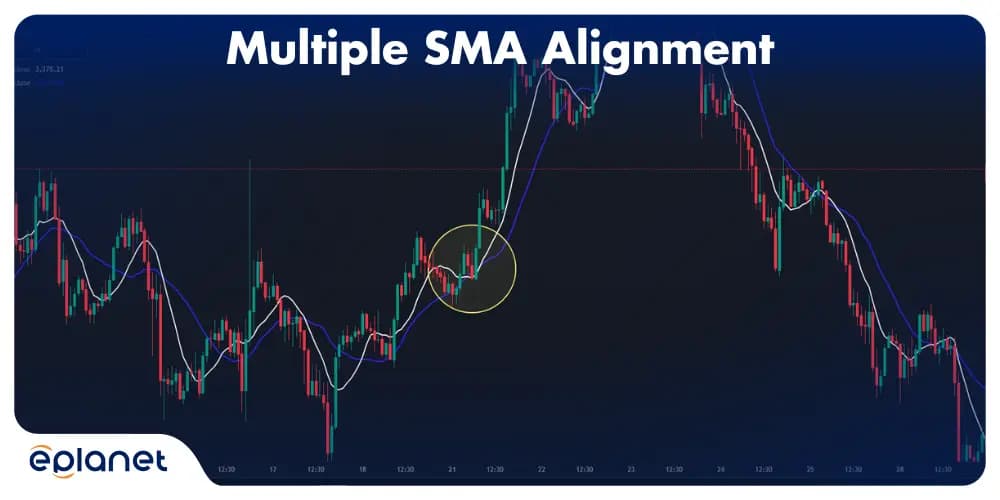
Multiple SMA System
Using multiple SMAs together is like having a team of advisors instead of just one opinion. A popular approach combines the 10, 20, and 50-day SMAs. When they’re aligned in ascending order (10 > 20 > 50), it suggests a strong uptrend. The reverse alignment indicates a strong downtrend.
The Triple MA Cross: A Real Test Case
Here's a strategy I ran personally during my early forex trading days, because I think it illustrates something important about combining multiple moving averages that most guides won't tell you.
I was using three moving averages simultaneously on the 1-hour chart: EMA, WMA, and SMA, all set to period 9. The logic was straightforward. When the EMA crossed above the SMA, that was the warning signal to pay attention. If the WMA then also crossed above the SMA, that was my entry trigger for a buy position. Stop loss went below the most recent swing low. I closed half the position at 1:1 risk-to-reward, moved the stop loss to breakeven, and closed the full trade when total profit hit 2x my initial risk. In practice, that meant entering with a $10 stop loss, taking $10 off the table at first target, and closing everything when the total reached $20.
It looked clean on paper. The entries were clear, the exits were defined, the rules had no grey areas. That kind of structure is genuinely useful when you're building discipline early on.
The problem was the win rate. After a month of live trading, I was sitting at around 30%. The strategy was generating entries, but the 1-hour timeframe was producing too many false crossovers in ranging conditions. Three short-period moving averages on the same chart in a sideways market will cross constantly. Every cross looks like a signal. Most of them aren't.
I stopped using it after that month. Not because the concept was wrong, but because the conditions it needed, a clean, sustained trend on the 1-hour chart, were not showing up often enough to make the win rate acceptable.
The takeaway isn't that triple MA setups don't work. It's that any crossover strategy needs a trend filter before the entry rules even activate. Without one, you're taking every signal the market throws at you regardless of context. That's a fast way to grind down an account even when your risk management is otherwise solid.
When to Use Simple Moving Average: Timing Is Everything
Knowing when to deploy your SMA arsenal is crucial. It's like knowing when to use a screwdriver versus a hammer—right tool, right job.
Perfect SMA Conditions:
- Trending markets: SMAs shine when there's a clear directional bias
- Medium to long-term analysis: Short-term noise gets smoothed out beautifully
- Volatile assets: Cryptocurrencies and growth stocks benefit from SMA smoothing
- Confluence analysis: Combining SMAs with other indicators for confirmation
Avoid SMAs When:
- Choppy, sideways markets: You'll get whipsawed faster than you can say "false signal"
- News-driven events: Fundamental events can override technical patterns
- Very short timeframes: On 1-minute charts, SMAs might be too slow
- Low-volume periods: Thin trading can create misleading signals
Advanced SMA Techniques: Level Up Your Game
Ready to graduate from SMA kindergarten? Here are some advanced techniques that separate amateur hour from professional trading.
Dynamic Support and Resistance Instead of static horizontal lines, use SMAs as moving support and resistance levels. The 200-day SMA is particularly revered as a major support/resistance line in many markets.
SMA Envelope Trading Create bands around your SMA (typically +/- 2-5%) to identify overbought and oversold conditions. When price hits the upper band, consider selling; lower band, consider buying.
Volume-Weighted Considerations While SMA doesn't include volume, pay attention to volume when price interacts with your moving average. High volume confirmations are more reliable than low volume signals.
Multi-Timeframe Analysis Use different SMA periods across various timeframes. A stock might be above its 50-day SMA (bullish short-term) but below its 200-day SMA (bearish long-term). This gives you a complete picture.
Common Mistakes and How to Avoid Them
Let me save you from the painful lessons I learned the hard way. These mistakes are like relationship red flags—ignore them at your own peril.
Mistake #1: Over-Reliance on SMAs Alone SMAs are powerful, but they're not crystal balls. Always combine them with other forms of analysis—fundamental, sentiment, or other technical indicators.
Mistake #2: Using the Wrong Time Period A day trader using a 200-day SMA is like using a telescope to read a book. Match your SMA period to your trading timeframe.
Mistake #3: Ignoring Market Context SMAs work differently in trending versus ranging markets. What works in a bull market might fail spectacularly in a bear market.
Mistake #4: Chasing Every Signal Not every SMA cross or interaction is worth trading. Quality over quantity should be your mantra.
Mistake #5: Getting the Strategy Right but the Position Size Wrong. A setup with a 60-70% win rate can still drain your account if you are risking 20-30% of capital per trade. Three or four consecutive losses, which is completely normal at any win rate, wipes out a large chunk before the edge has time to play out. Most traders who blow accounts are not losing because their SMA signals were wrong. They are losing because a single bad run at oversized positions does damage that weeks of good trading cannot recover. Keep risk per trade at 1-5% of capital regardless of how strong the signal looks on the chart.
Tools and Platforms: Where to Calculate SMAs
You don't need to be a math wizard or Excel expert to use SMAs effectively. Here are the best tools for the job:
Professional Platforms:
- TradingView (my personal favorite for its user-friendly interface)
- Bloomberg Terminal (if you have deep pockets)
- MetaTrader (great for forex)
- thinkorswim (comprehensive and free with TD Ameritrade)
Free Options:
- Yahoo Finance (basic but functional)
- Google Finance (simple charts)
- Investing.com (decent charting tools)
Mobile Apps:
- TradingView mobile
- Yahoo Finance app
- Robinhood (for basic analysis)
Most platforms calculate SMAs automatically—you just need to add them to your charts and customize the periods.
Building Your SMA System
Ready to create your own SMA-based trading approach? Here's a step-by-step blueprint:
Step 1: Choose Your Markets Start with liquid markets that trend well—major stock indices, large-cap stocks, or major currency pairs.
Step 2: Select Your Timeframes Match your SMAs to your trading style. Day traders might use 10 and 20-period SMAs on hourly charts, while swing traders prefer 20 and 50-day SMAs on daily charts.
Step 3: Define Your Rules Write down specific entry and exit criteria. For example: "Buy when price closes above 20-day SMA with increasing volume, sell when price closes below 10-day SMA."
Step 4: Backtest Your System Test your rules on historical data before risking real money. Most trading platforms offer backtesting features.
Step 5: Paper Trade First Practice with fake money until you're consistent and confident.
Step 6: Start Small Begin with small position sizes while you refine your system.
Common Variations and Customizations
While we've focused on the standard SMA, there are several useful variations worth knowing about:
Displaced Moving Average Shift your SMA forward or backward in time to reduce false signals or anticipate trend changes. It's like adjusting the timing on your car engine for optimal performance.
Adaptive Moving Average This variation automatically adjusts its calculation period based on market volatility. More volatile markets get faster SMAs, calmer markets get slower ones.
Hull Moving Average Created by Alan Hull, this variation aims to reduce lag while maintaining smoothness. It's more complex but can provide earlier signals.
Zero Lag Moving Average Another attempt to reduce the inherent lag in moving averages while maintaining their smoothing benefits.
Risk Management with SMAs
No discussion of trading indicators is complete without talking about risk management. SMAs can help you manage risk in several ways:
Position Sizing When price is far from major SMAs, consider smaller positions due to higher risk. When price is near support SMAs, you might increase position size with tighter stop losses.
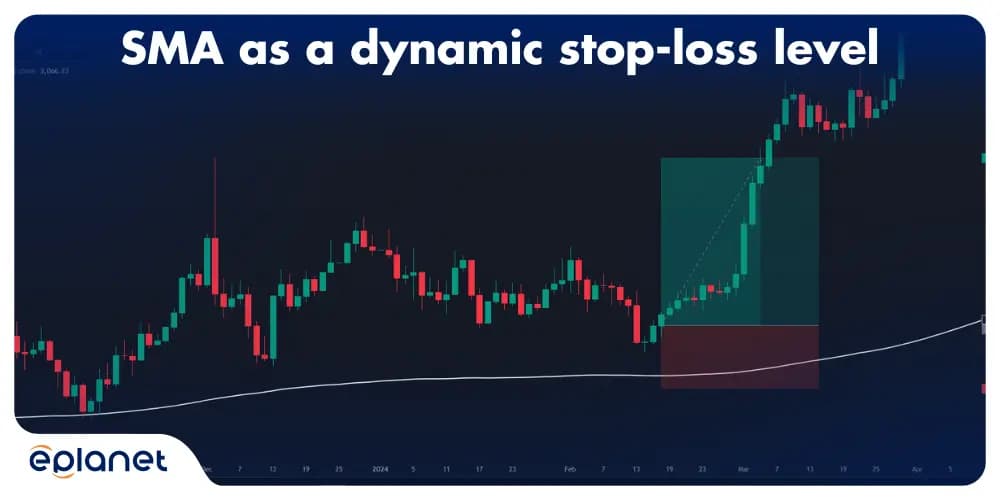
Stop Loss Placement Use SMAs as dynamic stop loss levels. For long positions, place stops below relevant SMAs; for short positions, above them.
Trend Confirmation Don't fight the major trend as defined by longer-term SMAs like the 200-day. Trading with the trend improves your odds significantly.
Exit Strategies SMAs can help you exit winning trades by providing clear levels where trend changes might occur.
Frequently Asked Questions
What SMA period works best for gold trading?
On XAU/USD, most active traders watch the 50-period and 200-period SMAs on the 4-hour chart to read the dominant trend. For intraday scalping on gold, shorter periods like the 20-period on the 5-minute or 15-minute chart are more useful. Gold reacts sharply to institutional order zones, so SMA levels on higher timeframes tend to carry more weight than on lower ones. If you are a day trader, start with the 50-period on the 1-hour chart and see how price respects or breaks it before moving to shorter timeframes.
How do you use SMA on MT5?
Open any chart on MetaTrader 5, click Insert, select Indicators, then Trend, and choose Moving Average. Set the period you want (20, 50, or 200 are good starting points), select Simple as the method, and apply it to the Close price. MT5 also lets you set alerts when price crosses an SMA level, which removes the need to watch the screen constantly. Once you understand the indicator, you can also use MT5's built-in scripting tools to automate SMA-based alerts entirely.
What is the difference between SMA and price action?
SMA is a calculated average of past closing prices. Price action is the direct reading of how candles are forming at specific levels right now. Experienced traders often use both together. The SMA tells you the broader trend direction. Price action tells you whether the current candle at that SMA level is rejecting or breaking through. A bearish shadow candle rejecting at a key SMA level, for example, carries more conviction than a close below the SMA without any rejection signal. Neither method is complete without the other.
Can you use SMA on a 5-minute chart?
Yes, and many intraday traders do. The 20-period and 50-period SMAs on the 5-minute chart are particularly useful for identifying short-term trend direction and spotting where price is likely to find support or resistance within a session. The tradeoff is that shorter timeframes produce more noise, so you will see more false signals than on a 1-hour or 4-hour chart. The standard approach is to use a higher timeframe SMA to confirm direction, then drop to the 5-minute chart to time the entry.
What is the most popular simple moving average period?
The 200-day SMA is the most watched by institutional traders across equity and currency markets. When major indices or currency pairs trade above their 200-day SMA, the long-term bias is considered bullish. The 50-day SMA is the next most referenced for medium-term trend analysis. For active forex and gold traders, the 20-period SMA on intraday charts is widely used as a dynamic support and resistance guide during trending sessions.
Do professional traders use simple moving averages?
Yes. The 200-day SMA in particular is built into institutional decision-making systems and algorithmic trading models. Professional traders do not use it in isolation though. They combine SMA levels with volume, price action confirmation, and session context. A price touching the 200-day SMA during a high-volume session is a very different signal from the same touch during thin Asian session trading.
When does an SMA stop working?
SMAs lose reliability in choppy, sideways markets where price keeps crossing back and forth over the line without committing to a direction. They also struggle during high-impact news events, when fundamental moves override technical levels entirely. The Powell press conference effect on gold is a good example. Spreads widen, stops get hunted, and the SMA level that held perfectly all morning becomes irrelevant for the duration of the event. The indicator itself is not broken in those moments. The market conditions just do not suit it.
Conclusion
The SMA is one of those tools that looks simple until you actually trade with it. The calculation takes about thirty seconds to understand. What takes longer is recognising when a signal has real trend behind it and when the market is just crossing your line without going anywhere. Most traders who struggle with moving averages are not misreading the indicator. They are trading it at the wrong position size or ignoring what the broader chart structure is doing at the same time.
Pick one or two periods, watch how price behaves around them across different sessions and conditions, and only add more once the basics start making sense in real time.