
Mastering the Best EMA for 5 Minute Charts
Maximize your trading edge with the Best EMA for 5 minute charts. Get precise signals for quick, profitable trades.
This guide details how Exponential Moving Averages (EMAs) rapidly capture trends and reversals on 5-minute charts. It covers EMA calculation, its superiority over SMAs, and techniques like crossovers and divergence to pinpoint trading entries and exits. Discover the best EMA for 5 minute charts to enhance your short-term trading success.
This comprehensive guide delves into the intricacies of using Exponential Moving Averages (EMAs) on 5-minute charts for successful short-term trading. We will explore the definition and calculation of EMAs, their advantages over Simple Moving Averages (SMAs), and how they can be effectively used to identify trends and opportunities in fast-moving markets. Brought to you by a reputable forex broker, this article uncovers the five leading EMAs that professional traders rely on for 5-minute charts to boost profits and mitigate risks.
Introduction to the Best EMA for 5 Minute Charts
In the ever-evolving world of financial markets, traders are constantly seeking tools and strategies to gain an edge. Technical analysis offers a structured approach to interpreting price movements and identifying potential trading opportunities. Among the various technical indicators available, Exponential Moving Averages (EMAs) have become a valuable tool for analyzing trends and making informed trading decisions. EMAs are particularly useful in short time frames, such as day trading or using lower time frames, as they are more sensitive to price changes than Simple Moving Averages (SMAs). This sensitivity is especially valuable in the Forex Market where rapid fluctuations and high liquidity demand swift, informed decision-making from traders.
EMAs are especially well-suited for short-term trading, specifically on 5-minute charts, where price fluctuations can be rapid and significant. By understanding the nuances of EMAs and their application on 5-minute charts, traders can gain valuable insights into market dynamics and improve their trading performance.
What are EMAs? Definition and Calculation
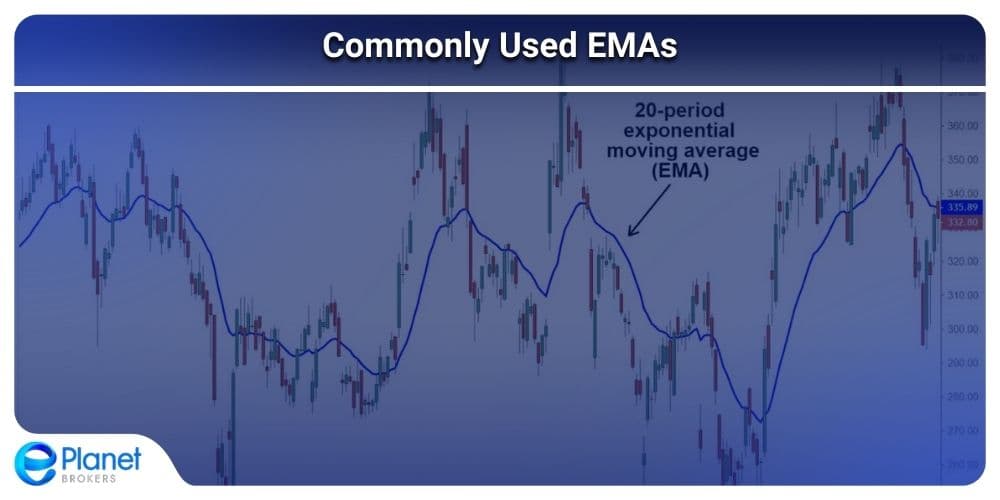
An EMA is a type of moving average that gives more weight to recent price data, making it more responsive to current market conditions than a Simple Moving Average (SMA). Unlike SMAs, which apply equal weight to all observations in the period, EMAs prioritize recent price changes, making them more suitable for traders who want to capture short-term trends. They provide more timely and accurate signals compared to other moving averages, making them a popular choice for traders and analysts.
Read More: Moving Average: The Ultimate Guide for Forex Traders
Step-by-Step EMA Calculation
The calculation of an EMA involves a smoothing factor or weighting multiplier, which determines the emphasis given to recent price data. The formula for calculating an EMA is as follows:
EMA = (Closing Price - Previous Day's EMA) x Multiplier + Previous Day's EMA
The multiplier is calculated using the formula:
Multiplier = 2 / (Number of Time Periods + 1)
For example, to calculate a 20-day EMA, the multiplier would be:
Multiplier = 2 / (20 + 1) = 0.0952
To calculate the EMA, you would first need to calculate the SMA for the initial EMA value. Then, using the formula above, you would calculate the EMA for each subsequent day, incorporating the previous day's EMA and the current day's closing price.
Best EMA for 5 Minute Charts
How EMAs Differ from SMAs
The key difference between EMAs and SMAs lies in how they weigh price data. SMAs give equal weight to all prices within the selected period, while EMAs assign greater weight to more recent prices. This difference in weighting makes EMAs more responsive to price changes and better suited for identifying short-term trends. One limitation of SMAs is that they may rely too heavily on outdated data since they give the same weight to yesterday's price as the price of one year ago.
Practical Trading Implications
This increased responsiveness is especially valuable on fast-moving 5-minute charts. EMAs can capture sudden price movements sooner, enabling traders to seize timely opportunities and manage risks more effectively.
For example, in a sudden price jump, the EMA will reflect this change faster than the SMA, potentially signaling a buying opportunity sooner. Conversely, if the price drops quickly, the EMA will adjust faster, potentially giving sell signals earlier. This quick reaction is especially helpful on a 5-minute chart where timing is crucial.
if you want to read more about SMAs, you can follow this article.
Smart Money Insights
In addition to quick EMA reactions, many professional traders, often referred to as Smart Money, use these indicators to track institutional trends and market sentiment. By observing Smart Money flows, traders can identify where larger market players are positioning themselves, thereby validating the buy and sell signals generated by EMA crossovers. Incorporating Smart Money insights into your EMA strategy bridges short-term technical signals with broader market dynamics, offering an extra layer of confidence on 5-minute charts.
Moreover, many traders also turn to Forex Factory for its real-time economic calendars, market news, and vibrant community discussions, all of which complement the technical insights offered by EMAs on 5-minute charts.
Why Use EMAs on 5-Minute Charts?
Five-minute charts strike a balance between providing enough detail for short-term trading and filtering out some of the noise present in even shorter timeframes. They offer a good compromise for day traders and swing traders alike, allowing for multiple trading opportunities throughout the day without the extreme volatility of 1-minute charts. Five-minute charts provide a good compromise for traders, offering enough detail for short-term trading while filtering out some of the noise present in even shorter timeframes.
EMAs are particularly valuable on 5-minute charts because they:
- React quickly to price changes: This is crucial in short-term trading, where even small price movements can significantly impact profitability.
- Identify trends early: EMAs can help traders spot emerging trends and reversals more quickly than SMAs, allowing them to enter and exit trades with better timing.
- Provide dynamic support and resistance levels: EMAs can act as dynamic support and resistance levels, helping traders identify potential entry and exit points.
- Filter out market noise: By smoothing out price fluctuations, EMAs can help traders focus on the underlying trend and avoid being distracted by short-term volatility.
- Capture momentum: Momentum traders wait for the market to have enough strength to push a currency in the desired direction and piggyback on the momentum in the hope of an extension move. A momentum strategy must have solid exit rules to protect profits.
Best EMA for 5 Minute Charts
How EMAs Can Help Identify Trends and Opportunities
EMAs can be used in various ways to identify trends and opportunities on 5-minute charts:
- Trend identification: The direction of the EMA line can indicate the overall trend. An upward-sloping EMA suggests an uptrend, while a downward-sloping EMA indicates a downtrend. The slope and angle of the EMA can give clues about the strength of the trend.
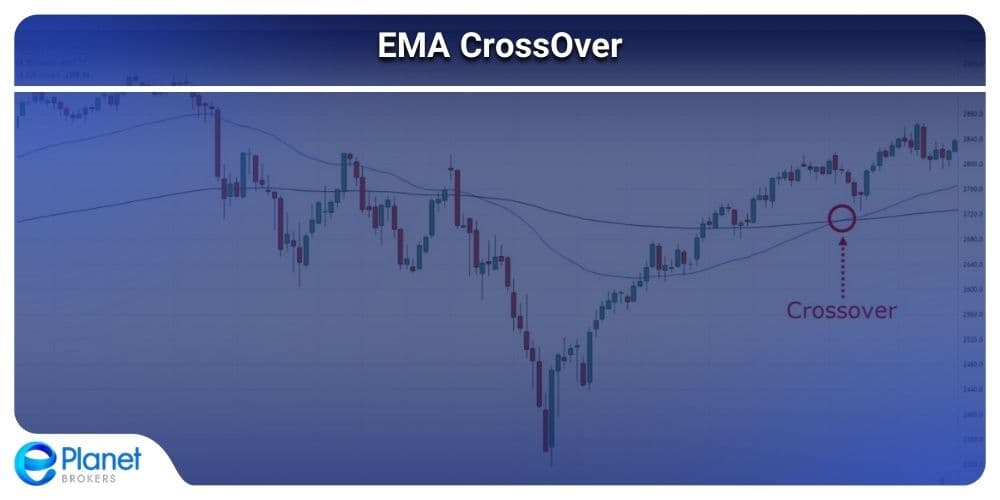
- Crossovers: When a shorter-term EMA crosses above a longer-term EMA, it can signal a bullish trend reversal, and vice versa. When the price is above the EMA line, it is likely to rise, and when it is below, it's likely to fall.
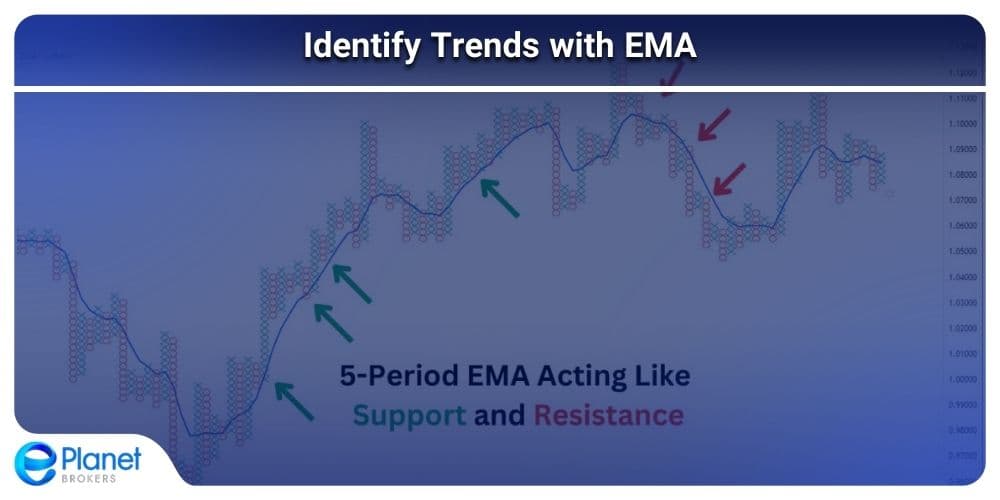
- Support and resistance: EMAs, similar to other types of moving averages, also function as support and resistance levels for prices. When the price approaches the EMA, it can act as a support or resistance level, and traders can use this information to make informed trading decisions.
- Divergence: Divergence between price action and the EMA can signal potential trend reversals.
Benefits of Short-Term Trading
Short-term trading, facilitated by the use of EMAs on 5-minute charts, offers several benefits:
- Multiple trading opportunities: 5-minute charts provide numerous trading opportunities throughout the day, allowing traders to capitalize on short-term price fluctuations.
- Reduced risk exposure: Short-term trades typically involve smaller position sizes and shorter holding periods, which can help limit potential losses.
- Faster learning curve: Short-term trading provides frequent feedback, allowing traders to quickly learn from their mistakes and refine their strategies.
- Increased flexibility: Short-term traders can adapt to changing market conditions more easily than long-term investors.
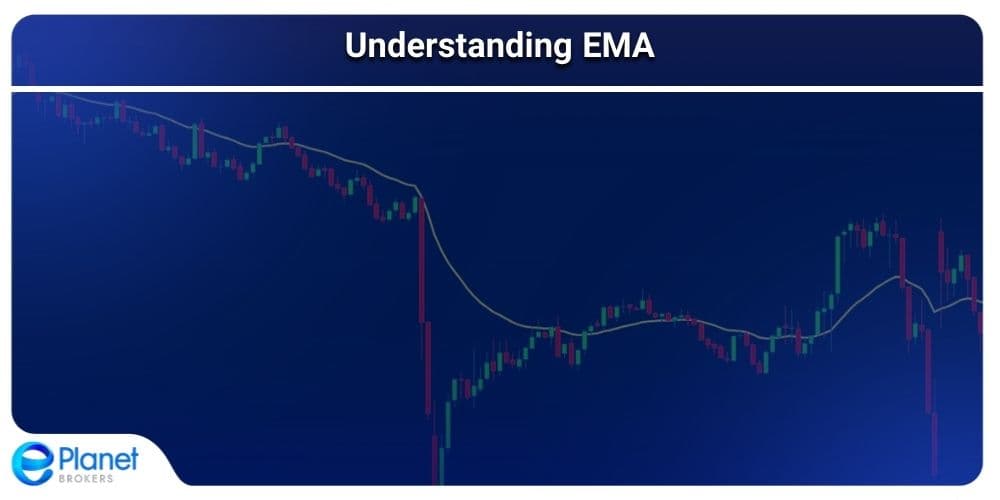
Understanding EMAs
Exponential Moving Averages (EMAs) are vital in technical analysis, smoothing price data to reveal trends. The EMA period depends on trading style: scalpers often choose shorter periods (e.g., 5 or 9 EMA) for fast trades, while day traders use 20 or 50 EMA and swing traders may opt for 100 or 200 EMA for larger moves. Market volatility matters too; shorter EMAs capture swift price changes in volatile markets, while longer EMAs reduce noise in stable ones. Ultimately, personal preference and consistent system performance guide the best EMA selection.
Key Factors Influencing EMA Choice
The choice of EMA period depends on several factors:
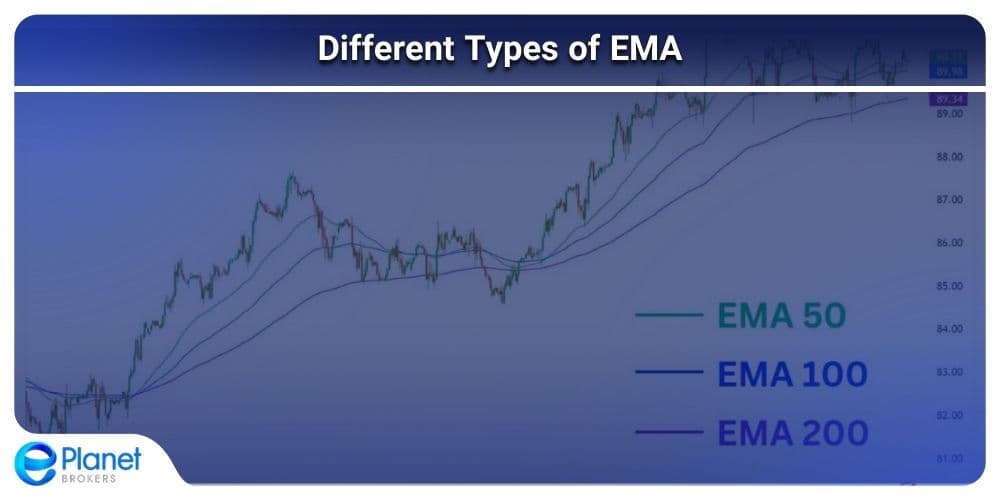
- Trading style: Scalpers may use shorter periods (e.g., 5 or 9 EMA) for quick trades, while day traders might prefer slightly longer periods (e.g., 20 or 50 EMA). Swing traders may use even longer periods (e.g., 100 or 200 EMA) to capture larger price swings. If your system works, and consistently makes good results, your system is valid. One person will find the SMA the best moving average for crypto, but someone else might find the EMA better.
- Market volatility: In volatile markets, shorter EMAs may be more suitable for capturing quick price movements, while longer EMAs can help filter out noise in less volatile markets.
- Personal preference: Ultimately, the choice of EMA period depends on the trader's individual preferences and trading style.
Best EMA for 5 Minute Charts
Commonly Used EMAs for 5-Minute Charts
EMA PeriodDescription5 EMAThis is a very short-term EMA that is extremely sensitive to price changes. It is often used by scalpers who need to make very quick trading decisions. It is part of the 5-8-13 EMA combination, a favored tool among day traders, providing a responsive and precise insight into fast-moving markets.8 EMAThis is another short-term EMA that is often used in combination with the 5 EMA and the 13 EMA. It provides a slightly smoother trend line than the 5 EMA. It is part of the 5-8-13 EMA combination, a favored tool among day traders, providing a responsive and precise insight into fast-moving markets.9 EMAThis is a fast-moving average that is highly responsive to price changes, making it suitable for scalping and short-term trading.13 EMAThis EMA is often used in combination with the 5 EMA and the 8 EMA. It provides a smoother trend line than the 8 EMA and can help to filter out some of the noise in the market. It is part of the 5-8-13 EMA combination, a favored tool among day traders, providing a responsive and precise insight into fast-moving markets.20 EMAThis EMA offers a balance between responsiveness and reliability, making it a popular choice for day traders. It is often used to gauge short-term trends.50 EMAThis EMA is often used to confirm trends and filter out false breakouts. It is considered a medium-term indicator and helps identify the intermediate market direction.100 EMAThis EMA can act as a dynamic support and resistance level, particularly useful for swing traders.200 EMAThis EMA provides a long-term perspective on the market trend, even on a 5-minute chart. It is crucial for determining overall market direction.
How to Use EMAs Effectively
Using EMAs effectively involves identifying trends and determining entry and exit points. On a 5-minute chart, a price above the EMA indicates an uptrend, while a price below suggests a downtrend. The EMA’s slope reveals trend strength, a steeper slope signals stronger momentum. EMA crossovers, such as a 9 EMA crossing above a 20 EMA, confirm trend reversals. In an uptrend, traders might buy on pullbacks to the EMA, and in a downtrend, sell when prices rebound off the EMA. Always combine EMA signals with other indicators for enhanced accuracy.
Identifying Trends
EMAs can be used to identify both upward and downward trends on 5-minute charts. When the price is consistently above the EMA, it suggests an uptrend, while the price consistently below the EMA indicates a downtrend. The slope of the EMA line can also provide insights into the strength of the trend. A steeper slope suggests a stronger trend, while a flatter slope indicates a weaker trend or a potential consolidation phase.
Traders can use EMA crossovers to confirm trend changes. For example, when a shorter-term EMA (e.g., 9 EMA) crosses above a longer-term EMA (e.g., 20 EMA), it can signal a bullish trend reversal. Conversely, when the shorter-term EMA crosses below the longer-term EMA, it can indicate a bearish trend reversal.
Finding Entry and Exit Points
EMAs can be used to identify potential entry and exit points for trades. In an uptrend, traders might look to buy when the price pulls back to the EMA or when a shorter-term EMA crosses above a longer-term EMA. In a downtrend, traders might consider selling when the price bounces off the EMA or when a shorter-term EMA crosses below a longer-term EMA.
It's important to combine EMA signals with other indicators or price action patterns to confirm entry and exit points. For example, traders might look for bullish candlestick patterns near the EMA in an uptrend or bearish candlestick patterns near the EMA in a downtrend.
Combining EMAs with Other Indicators
Combining EMAs with other indicators can create powerful trading strategies. Here are some examples:
- EMA with RSI: The RSI can be used to identify overbought or oversold conditions, which can help confirm EMA-based trading signals. For example, if the EMA indicates an uptrend and the RSI is not in overbought territory, it could be a safer time to buy.
- EMA with MACD: The MACD can be used to confirm trend direction and strength. For instance, if the EMA shows an uptrend and the MACD line crosses above the signal line, it can reinforce a buy decision.
- EMA with Bollinger Bands: Bollinger Bands can be used to gauge market volatility. If prices touch the upper Bollinger Band while the EMA shows an uptrend, it may signal an overbought condition, suggesting caution.
Advanced EMA Techniques for 5-Minute Charts
Utilize EMA crossovers to pinpoint trend changes: a short-term EMA crossing above a long-term EMA signals a bullish golden cross, while the reverse indicates a bearish death cross. Combine multiple EMA periods—such as a 9-period with a 21-period—to generate clear buy and sell signals. Watch for EMA divergence, where discrepancies between price movement and EMA trends may foreshadow reversals. Enhance analysis further by incorporating multi-timeframe techniques, like pairing a daily 200-period EMA with a 5-minute 20-period EMA, to refine entry and exit decisions.
Best EMA for 5 Minute Charts
EMA Crossovers
EMA crossovers are a powerful technique for identifying trend changes and generating trading signals. When a shorter-term EMA crosses above a longer-term EMA, it is known as a golden cross, which is a bullish signal. Conversely, when a shorter-term EMA crosses below a longer-term EMA, it is called a death cross, which is a bearish signal.
Traders often use a combination of EMAs with different periods to identify crossovers. For example, a common setup is to use a 9-period EMA and a 21-period EMA. When the 9 EMA crosses above the 21 EMA, it generates a buy signal, while a crossover in the opposite direction generates a sell signal.
EMA Divergence
EMA divergence occurs when the price action diverges from the direction of the EMA. This can signal a potential trend reversal. For example, if the price is making higher highs while the EMA is making lower highs, it could indicate that the upward trend is losing momentum and a reversal may be imminent.
Multi-Timeframe Analysis
Multi-timeframe analysis involves using EMAs on different timeframes to gain a broader perspective on the market trend. For example, a trader might use a 200-period EMA on a daily chart to identify the long-term trend and then use a 20-period EMA on a 5-minute chart to identify entry and exit points within that trend.
Risk Management and Trading Psychology
Risk management is vital in trading, especially in short-term markets where losses can accumulate rapidly. Techniques such as setting stop-loss orders, proper position sizing based on risk tolerance, and diversifying trades help limit exposure. Equally essential is trading psychology; maintaining emotional control prevents impulsive decisions driven by fear or greed. Sticking to a well-defined trading plan fosters discipline, protects capital, and contributes to long-term trading success.
Importance of Risk Management
Risk management is crucial for any trading strategy, especially in short-term trading where losses can accumulate quickly. Some essential risk management techniques include:
- Setting stop-loss orders: Stop-loss orders are used to limit potential losses by automatically closing a trade when the price reaches a predetermined level.
- Position sizing: Position sizing involves determining the appropriate amount of capital to risk on each trade based on your risk tolerance and account size.
- Diversification: Diversifying your trades across different assets can help reduce overall portfolio risk.
- Forex Calculator: Enhance your risk management strategy by integrating a Forex Calculator into your trading routine. This essential tool helps you quickly determine pip values, calculate optimal position sizes, and set precise risk parameters, crucial for making swift, informed decisions on fast-paced 5-minute charts
Emotional Control
Emotional control is essential for successful trading. Fear and greed can lead to impulsive decisions that can derail your trading plan. It's important to stick to your trading plan and avoid making emotional trades.
Best EMA for 5 Minute Charts
Advanced EMA Alternatives for 5-Minute Charts (November 2025 Update)
While traditional Exponential Moving Averages remain popular among traders, 2025 has seen a significant shift toward more advanced moving average variants that address some of EMA's inherent limitations. These modern alternatives offer improved responsiveness, reduced lag, and better noise filtration—critical advantages for the fast-paced environment of 5-minute chart trading.
Hull Moving Average (HMA)
The Hull Moving Average, developed by Alan Hull, represents a significant advancement in moving average technology. Unlike traditional EMAs that struggle to balance responsiveness with smoothness, the HMA achieves both simultaneously through its unique calculation method.
How HMA Works
The HMA uses weighted moving averages and incorporates a square root period to dramatically reduce lag while maintaining curve smoothness. The calculation involves three steps:
- Calculate a Weighted Moving Average (WMA) with period n/2 and multiply by 2
- Calculate a WMA for period n
- Subtract the second WMA from the first and calculate another WMA with period √n
This mathematical approach makes the HMA significantly more responsive to price changes than traditional EMAs, often by several periods.
HMA Benefits for 5-Minute Trading
- Reduced Lag: The HMA reacts to price movements almost instantaneously, making it ideal for capturing quick reversals on 5-minute charts
- Smoother Line: Despite its responsiveness, the HMA maintains a smooth curve that filters out market noise better than short-period EMAs
- Clearer Signals: Crossovers and trend changes are more defined, reducing false signals
- Better Entry/Exit Timing: The combination of speed and smoothness helps traders enter trends earlier and exit before reversals fully develop
Recommended HMA Periods for 5-Minute Charts
- HMA 9: Ultra-responsive for scalping, similar to a 5 EMA but smoother
- HMA 16: Excellent balance for day trading on 5-minute charts
- HMA 25: Good for confirming trends and filtering false breakouts
- HMA 49: Acts as dynamic support/resistance, comparable to a 50 EMA but more accurate
HMA Trading Strategy Example
A powerful 5-minute chart strategy combines:
- HMA 9 (fast line) - for entry signals
- HMA 16 (medium line) - for trend confirmation
- HMA 49 (slow line) - for overall trend direction
Buy Signal: When HMA 9 crosses above HMA 16, and both are above HMA 49 Sell Signal: When HMA 9 crosses below HMA 16, and both are below HMA 49
ALMA (Arnaud Legoux Moving Average)
The Arnaud Legoux Moving Average is another modern alternative gaining traction in 2025, particularly among algorithmic traders and those dealing with highly volatile assets like cryptocurrencies.
What Makes ALMA Different
ALMA uses a Gaussian distribution to apply weights to price data, which results in a moving average that can be both incredibly smooth and remarkably responsive. Unlike EMAs that always weight recent data most heavily, ALMA allows traders to adjust where the emphasis is placed within the lookback period.
ALMA Key Parameters
ALMA has three adjustable parameters:
- Period (Window): The number of bars to include (similar to EMA period)
- Offset: Determines where the Gaussian curve is centered (0 = start, 1 = end)
- Sigma: Controls the width of the Gaussian curve (higher = smoother)
ALMA Benefits for 5-Minute Trading
- Superior Noise Reduction: ALMA filters out random price spikes better than traditional EMAs while maintaining trend responsiveness
- Customizable Sensitivity: Traders can fine-tune ALMA's behavior to match their specific trading style and market conditions
- Reduced Whipsaws: In choppy, range-bound markets common on 5-minute charts, ALMA produces fewer false signals
- Adaptive Nature: Works well across different market conditions without requiring constant parameter adjustments
Recommended ALMA Settings for 5-Minute Charts
For day trading on 5-minute charts, these settings work well:
- ALMA (20, 0.85, 6): Balanced approach, similar to a 20 EMA but smoother
- ALMA (50, 0.90, 6): Medium-term trend identification with minimal lag
- ALMA (9, 0.80, 4): Fast-moving for scalping strategies
The offset value between 0.80-0.90 provides good responsiveness while maintaining smoothness. Lower sigma values (4-6) work best for 5-minute charts.
ALMA Trading Strategy Example
Trend Following with ALMA:
- Use ALMA (20, 0.85, 6) as your primary trend indicator
- Enter long when price crosses above ALMA and ALMA is sloping upward
- Enter short when price crosses below ALMA and ALMA is sloping downward
- Place stop-loss just beyond the ALMA line
- Exit when price crosses back through ALMA in the opposite direction
Comparing EMA, HMA, and ALMA
FeatureTraditional EMAHull Moving Average (HMA)ALMALagModerateVery LowLowSmoothnessModerateHighVery HighResponsivenessGoodExcellentExcellentNoise FiltrationModerateGoodExcellentFalse SignalsModerateLowVery LowComplexitySimpleModerateComplexBest ForGeneral tradingFast reversals, scalpingVolatile markets, trend followingLearning CurveEasyModerateSteeper
When to Use Each Alternative
Choose HMA When:
- Trading highly liquid pairs or stocks with clear trends
- Scalping or very short-term trading (5-15 minute holding periods)
- You need to catch trend reversals as early as possible
- Market conditions show clear directional movements
Choose ALMA When:
- Trading volatile assets like cryptocurrencies
- Market conditions are choppy or range-bound
- You want to reduce false signals and whipsaws
- You're willing to sacrifice a tiny bit of speed for significantly better accuracy
Stick with Traditional EMA When:
- You're a beginner learning moving average concepts
- Your strategy is already proven and profitable with EMAs
- You prefer simplicity and standardization
- You're using automated trading systems built around EMAs
Combining Traditional and Advanced Moving Averages
Many professional traders in 2025 use a hybrid approach, combining traditional EMAs with advanced alternatives:
Multi-MA System Example:
- HMA 16 - Primary entry signal line
- EMA 50 - Trend confirmation and institutional reference point
- ALMA (20, 0.85, 6) - Dynamic support/resistance
This combination provides the responsiveness of HMA, the market-standard reference of EMA 50, and the noise filtration of ALMA.
Important Considerations
Backtesting is Essential
Before using HMA or ALMA in live trading:
- Test thoroughly on historical data specific to your trading instruments
- Compare performance against traditional EMA strategies
- Account for different market conditions (trending, ranging, volatile)
- Validate that the improvement justifies the additional complexity
Platform Availability
Not all trading platforms offer HMA and ALMA by default:
- TradingView: Both HMA and ALMA available as built-in indicators
- MetaTrader 4/5: Require custom indicators (freely available)
- NinjaTrader: Both available in indicator library
- ThinkOrSwim: HMA available; ALMA requires custom coding
Don't Overcomplicate
While these advanced indicators offer improvements, remember:
- A simple EMA strategy executed with discipline often beats a complex system used inconsistently
- More indicators don't necessarily mean better results
- Focus on mastering one approach before adding layers of complexity
The Future of Moving Averages
As we progress through 2025, the trend toward adaptive and AI-enhanced indicators continues. Some trading platforms now offer machine learning algorithms that automatically adjust moving average parameters based on current market conditions, volatility, and even time of day. While still in early stages, these adaptive moving averages represent the next evolution beyond HMA and ALMA.
For 5-minute chart traders, staying informed about these advanced alternatives while maintaining discipline with proven strategies remains the key to long-term success.
Conclusion
EMAs are a valuable tool for traders of all levels, especially those interested in short-term trading strategies. By understanding the principles of EMAs and their application on 5-minute charts, traders can gain a deeper understanding of market dynamics and improve their trading performance.
This guide has provided a comprehensive overview of EMAs, covering their definition, calculation, advantages, and various techniques for using them effectively. To explore how EMAs compare to other forex indicators, check out our Ultimate Guide to The most popular technical indicators.
Remember to combine EMAs with other indicators, practice risk management, and maintain emotional control to enhance your trading success.
Key Takeaways:
- Identify your trading style and risk tolerance: This will help you determine the appropriate EMA periods and risk management techniques to use.
- Combine EMAs with other indicators: This can help confirm trading signals and provide a more complete picture of the market.
- Practice on a demo account: Before risking real capital, practice your EMA strategy on a demo account to gain experience and refine your approach.
- Continuously learn and adapt: The financial markets are constantly evolving, so it's essential to stay updated on new techniques and adapt your strategy as needed.
By following these guidelines and consistently applying the principles outlined in this guide, you can increase your chances of success in the dynamic world of short-term trading.
The Bottom Line
For traders using 5-minute charts, selecting the Best EMA for 5 Minute Charts is essential. This article outlined five key EMAs trusted by professionals to swiftly capture trends, pinpoint entry and exit points, and manage risk. By integrating these EMAs with sound trading practices, you can enhance precision, maximize profits, and minimize losses in fast-moving markets.