
GDP Explained: Your Ultimate 2026 Guide to Understanding Economic Power
GDP measures a nation's economic health, tracking all goods and services produced within its borders. This guide breaks down what GDP means, how it's calculated, why America's GDP stands out globally, and what it means for your financial future. Discover the true impact of Gross Domestic Product beyond the headlines.


Introduction
Ever wondered why economists obsess over a single number that somehow tells us if we’re winning or losing at the money game? That’s GDP for you—three simple letters that, as we discussed in our Ultimate Guide to the Forex Factory Calendar, can send markets soaring or politicians scrambling. I’ve always found it fascinating how this one metric has become the scoreboard for entire countries.
Key Takeaways
- Gross Domestic Product measures the total value of all goods and services produced within a country's borders during a specific timeframe.
- GDP = Consumption + Investment + Government Spending + (Exports - Imports), often simplified as C + I + G + (X - M).
- GDP doesn't count unpaid work, underground economies, environmental impacts, or wealth distribution—critical factors in overall economic health.
- A technical recession occurs after two consecutive quarters of negative GDP growth, though official declarations consider broader economic factors.
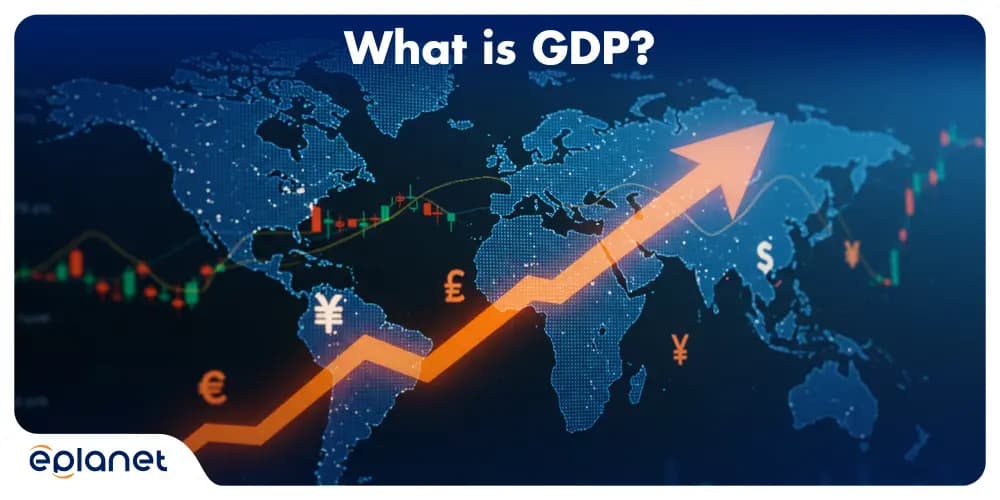
What is GDP?
GDP, or Gross Domestic Product, is like the financial report card for a country. It measures the total value of all goods and services produced within a nation's borders over a specific time period, usually a quarter or a year. But it's more than just a number—it's the pulse of a nation's economic health.
Think of GDP as taking the temperature of an economy. When it's rising, things are generally looking up. When it's falling... well, that's when economists start using words like "downturn" and "recession" that make everyone nervous.
Is GDP the Same as Income?
While GDP and national income are closely related, they're not exactly the same thing. GDP measures production, while national income measures earnings. Think of it this way: GDP is what a country produces, while national income is what a country earns.
It's like the difference between how many hours you worked versus how much money you took home. They're related, but not identical.
What is GDP?
How is GDP Calculated? The Behind-the-Scenes Math
Calculating GDP is a bit like making grandma’s secret recipe – there’s more than one way to do it, and economists argue about which method is best. But there are three main approaches:
- The Production (or Output) Approach: Add up the value of all goods and services produced.
- The Income Approach: Add up all the income earned by households and firms.
- The Expenditure Approach: Add up all spending on final goods and services.
The expenditure approach is the most commonly used method in the United States, and it looks like this formula:
GDP = C + I + G + (X – M)
Where:
- C is consumer spending: that’s you (and everyone else in your country) buying goods and services.
- I is business investment: that’s companies in your country purchasing equipment and building factories.
- G is government spending: that’s your government funding the military, building roads and schools.
- X is exports: that’s what your country sells to other nations.
- M is imports: that’s what your country buys from other nations.
The Bureau of Economic Analysis (BEA) crunches these numbers every quarter, and I’m always amazed at how they manage to track such an enormous amount of economic activity.
What is Not Included in GDP?
GDP has some blind spots. It doesn't count:
- Unpaid work: That includes housework, childcare, or volunteer activities. Sorry, parents—all those hours of unpaid labor don't factor into GDP.
- Underground economy: Black market transactions, illegal activities, and cash deals that aren't reported to the government.
- Secondhand sales: That vintage jacket you bought? Not counted (unless the seller was a business that marks up used goods).
- Non-market transactions: Bartering goods and services doesn't make it into the official numbers.
- Environmental degradation: Cutting down forests might boost GDP in the short term, but the environmental cost isn't deducted.
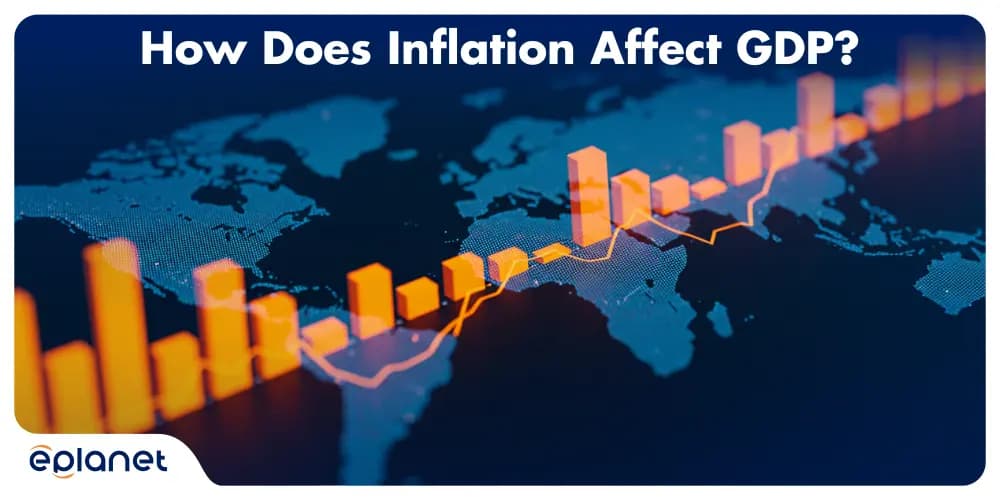
What Does Inflation Mean for GDP?
Inflation is like a fun-house mirror for GDP—it distorts the true picture. That's why economists distinguish between nominal GDP (current dollar values) and real GDP (adjusted for inflation).
Imagine your salary doubled, but the price of everything else doubled too. Are you actually richer? Not really. The same principle applies to GDP. If GDP grows by 5% but inflation is 3%, the real growth is only 2%.
Inflation's Effect on GDP
How to Find Real GDP: The Inflation-Adjusted Truth
Real GDP is what economists use to measure actual economic growth by removing the effects of inflation. Here's how it works:
- Measure the current year's output in current prices (nominal GDP)
- Adjust those figures using a price index (like the GDP deflator)
- The result gives you GDP in constant dollars (real GDP)
The formula is: Real GDP = Nominal GDP ÷ GDP Deflator × 100
This adjustment is crucial because it tells us whether the economy is actually producing more goods and services or if prices are just going up.
Is the GDP Adjusted for Inflation?
When you hear economic reports on the news, they're usually talking about real GDP growth rates, which are adjusted for inflation. However, when comparing the absolute size of economies (like saying the US has a $25 trillion economy), they're typically using nominal GDP figures.
How GDP Affects Forex Trading
Here’s why currency markets hit a frenetic pace every time a GDP report is released. While GDP represents raw economic activity for economists, for traders, it marks one of the most important economic statistics of the month.
GDP readings are considered Tier 1 economic events by the Bureau of Economic Analysis, which means they can move markets sharply. The degree of the move is often dependent on the degree to which the printed number deviates from forecasts. A reading that comes in on forecast, for example, is highly unlikely to move the currency pair or the price of gold much, while a reading that sharply surprises — whether positively or negatively — can see the pair and the precious metal make sharp and sustained moves in a matter of minutes.
What a Strong GDP Reading Means for Traders
When GDP figures are released they represent the growth in the economy relative to the quarter or year before. If the figure beats expectations, many view this as a positive for the economy as it signals growth in the economy is proceeding at a higher pace than had been previously anticipated. As a result, the currency tends to appreciate because there is an increased likelihood of the central bank hiking interest rates in order to keep a lid on inflation. Higher interest rates attract more foreign capital to a country increasing demand for the currency.
With Forex traders relying heavily on the U.S. GDP reading, a stronger than expected number tends to create dollar strength across many currency pairs including USD/JPY, EUR/USD and GBP/USD in the immediate hours following the report.
What a Weak GDP Reading Means for Traders
The opposite applies, however, when GDP comes in below expectations. With economic contraction evident, no likelihood of a rate hike, and even the possibility of a rate cut, the currency is likely to depreciate as capital is repatriated from riskier emerging markets seeking returns elsewhere.
The extreme slow down in U.S. real GDP growth from 4.4% in Q3 2025 to only 0.5% in Q4 2025 and subsequent fast recovery to 2.0% in Q1 2026 is the type of unpredictability and volatility that seasoned traders plan for and not react to.
GDP and Gold: What XAU/USD Traders Need to Know
Most GDP commentaries stop at analyzing currency, but here at GDP we like to think of currency as only half of the picture for traders, the other half being gold. And when it comes to gold, U.S. GDP performance provides an equally valuable prognosis for the metal. When U.S. GDP performance comes in below expectations the dollar is typically weak, and as the currency in which gold is globally priced, this helps to drive the gold price up. Conversely, when U.S. GDP performance is better than consensus the dollar rises and puts gold under pressure.
In addition to being an important release for Forex pairs, XAU/USD traders also tend to pay very close attention to the GDP release. With the strong correlations between currency prices, gold prices, and risk off/risk on trades, this data point creates the type of high-impact trade opportunity that can create very sharp and clean trades in both directions, which is among the most desirable conditions for a successful XAU/USD trade. As a result, XAU price action on GDP days tends to trend in a clean manner in a large range, creating many ideal entries for both long and short trades. Therefore, it would be wise to include the GDP reports in your trade planning.
How to Trade Around GDP Releases
Most traders think of GDP release trading in terms of reacting to the number at the moment it hits the wire. The reality is that the move happens instantly, by the time a retail trader figures out what the number was, the entire trade has already been priced in. So don’t get bogged down by trying to make a great trade on a big release, instead pay attention to the expectation heading into the number, mark key levels before release on your charts, and then enter the same trade whether or not the number beats or misses expectations.
GDP numbers are generally viewed as a confirmation for experienced traders as a release can act as a strong validate of a developing trade setup, providing that move is headed in the same direction as the traded position; in fact, it is this correlation between fundamental data and technical trades that harbors genuine trade potential.
Everyone wants to know where the economy is headed. The GDP report answers that exact question and comes out on a quarterly basis roughly 4 weeks after the end of the reporting quarter with initial results followed by two months of revisions to those results. If you don't put GDP release dates in your economic calendar, then you're shooting in the dark.
What is a Recession? The GDP Rollercoaster
Technically, a recession is defined as two consecutive quarters of negative GDP growth. But in practice, the National Bureau of Economic Research (NBER) looks at a broader set of indicators before making the official call.
Think of a recession as the economy catching a cold. Activity slows down, businesses get cautious, people lose jobs, and everyone feels a bit under the weather financially.
Is America in a Recession?
Is the U.S. economy in a recession? As of mid-2026, the answer is no. But a big drop in real GDP in Q4 2025 tells more than a simple yes or no. Growth fell from 4.4 % in Q3 2025 to a mere 0.5 % in Q4 2025, where it likely lost about 1 % of growth due to a federal government shutdown that lasted from October through mid-November 2025. However, in Q1 2026, real GDP expanded at an annualized rate of 2.0 %, according to the advance estimate for Q1 2026 released by the Bureau of Economic Analysis in April 2026.
For the trader, it is the large moves in the numbers - 4.4%, then 0.5%, then 2.0% over the 3 quarters that have passed - that create so much attention for GDP releases. The high-impact indicator on the economic calendar often throws people because no one ever expected such dramatic swings from quarter to quarter. But the high volatility and sharp swings have to make one consider that it is not the number itself which is so important, it is the back story behind the figures.
What is the USA GDP Right Now? America's Economic Pulse
The U.S. GDP stands as the world's largest economy, with a nominal GDP of approximately $29 to $31 trillion as of early 2026. That figure has grown significantly from the $25 trillion mark cited in 2024, reflecting continued economic expansion despite a turbulent period of slowing growth and geopolitical uncertainty.
What is the Current U.S. Debt?
The national debt has now climbed to $37.6 trillion at the end of fiscal year 2025 — an increase of $2.2 trillion in just one year. Corresponding to this sharp rise in debt is a dramatic increase in interest payments on the debt — now a whopping $1.2 trillion for FY2025, exceeding the amount spent on national defense. Looking ahead to early 2026, another significant debt milestone has been reached: public debt held by foreign investors and domestic residents now exceeds the nation’s gross economic output, or GDP, for the first thing in history, recording a debt-to-GDP ratio above 100 percent.
It’s a fun comparison: when US debt levels have now exceeded the annual US salary, and represent more money going to interest on the debt than most people spend on rent, it’s fair to say that things are not going well. Economists and policymakers are starting to take notice too.
Is U.S. GDP Dropping?
U.S. GDP is not dropping, but growth has been uneven. After a strong 4.4 percent expansion in Q3 2025, growth slowed sharply to 0.5 percent in Q4 2025 before recovering to 2.0 percent in Q1 2026. Business investment — likely driven by spending in artificial intelligence infrastructure — was a key driver of the Q1 rebound, even as consumer spending softened and a weak housing market continued to weigh on growth. The economy's underlying strength, measured by a category that strips out volatile items like exports and inventories, grew at a solid 2.5 percent pace in Q1 2026.
Why is the U.S. GDP so High?
The U.S. has several advantages that contribute to its massive GDP:
- Diverse economy: From tech to agriculture, manufacturing to services, America has it all.
- Innovation hub: Silicon Valley, Boston's biotech corridor, and other innovation centers drive growth.
- Stable institutions: Property rights, legal systems, and financial markets that (mostly) work.
- Large consumer base: 330+ million people with relatively high purchasing power.
- Global reserve currency: The dollar's status gives the U.S. significant economic advantages.
What is the Highest GDP in U.S. History?
In nominal terms, the highest U.S. GDP on record is the current one — approximately $29 to $31 trillion as of early 2026, continuing the long-term upward trend that has characterized the American economy for decades, interrupted only by the 2008 financial crisis and the 2020 pandemic contraction.
When adjusted for inflation, the U.S. economy has also reached its highest real GDP in history in recent years, confirming that the growth reflects genuine increases in output — not just rising prices.
Who Has the Highest GDP in the World? The Global Economic Leaderboard
The United States still holds the top spot for the highest GDP in the world, followed by China, Japan, Germany, and India. However, when measured by purchasing power parity (PPP), which adjusts for price differences between countries, China has surpassed the U.S.
What are the Three Richest Countries in the World?
If we're talking about GDP per capita (which is GDP divided by population and gives us a better sense of individual wealth), the richest countries are:
- Luxembourg
- Singapore
- Ireland
These small countries have high productivity and specialized economies that generate enormous wealth relative to their population size.
However, if we're looking at total GDP, the richest countries are:
- United States
- China
- Japan
Who is the No. 1 GDP Country?
The United States remains the world's largest economy in terms of nominal GDP. With approximately 25% of global nominal GDP, America's economic output is truly staggering. To put it in perspective, if U.S. states were countries, California alone would rank as the 5th largest economy in the world.
Who Has the Highest GDP in the World?
While the U.S. has the highest nominal GDP, China has the highest GDP based on Purchasing Power Parity (PPP). This means that when you adjust for the fact that goods and services in China generally cost less than in the U.S., China's economy is actually larger.
It's like comparing someone who makes $100,000 in New York City to someone who makes $70,000 in a small town where everything is half the price. The second person might actually have more purchasing power despite the lower nominal income.

The country with the highest GDP in the world is the United States
Does GDP Mean Wealth? The Big Misconception
GDP is not the same as wealth. GDP measures the flow of economic activity in a given period, while wealth represents the accumulated assets minus liabilities at a specific point in time.
Think of GDP as your annual salary, while wealth is your net worth (everything you own minus everything you owe). They're related, but different concepts.
Is a High GDP Good or Bad?
A high GDP is generally considered positive—it means a country is producing lots of goods and services. However, GDP alone doesn't tell the whole story of a nation's wellbeing or economic health.
After all, a country could have a high GDP but also high inequality, poor health outcomes, or environmental degradation. That's why many economists suggest looking at other measures alongside GDP, such as:
- GDP per capita
- Income inequality metrics
- Environmental indicators
- Health and education outcomes
- Happiness indices
Is GDP a Wealth or Income?
GDP is closer to income than wealth. It measures the flow of economic activity over time, not the stock of accumulated assets. However, it's not exactly personal income either—it's the income generated by all productive activities within a country.
What is an Example of GDP? Making it Tangible
Let's break this down with a simple example. Imagine a tiny economy with just three businesses:
- Farm: Produces $100 worth of wheat
- Mill: Buys the wheat for $100, processes it, and sells $150 worth of flour
- Bakery: Buys the flour for $150, bakes it, and sells $250 worth of bread
The GDP isn't $100 + $150 + $250 = $500. That would be double-counting. Instead, we look at the value added at each stage:
- Farm: $100 (full value)
- Mill: $50 (flour value minus wheat cost)
- Bakery: $100 (bread value minus flour cost)
So the GDP is $100 + $50 + $100 = $250, which is the value of the final product (bread).
What is a Real GDP Example?
Let's say our tiny bread economy produced exactly the same amount of bread in 2023 and 2024, but due to inflation, the price of bread rose from $250 to $275.
- Nominal GDP in 2023: $250
- Nominal GDP in 2024: $275
- Inflation rate: 10%
Despite the 10% increase in nominal GDP, real GDP would be unchanged because the actual output (the amount of bread) stayed the same. The real GDP for 2024, expressed in 2023 dollars, would still be $250.
What is GDP in a Sentence?
GDP is the total market value of all final goods and services produced within a country during a specific time period.
What are the Three Types of GDP?
- Nominal GDP: The value of all final goods and services measured at current market prices.
- Real GDP: Nominal GDP adjusted for inflation, which shows actual economic growth.
- GDP per capita: Total GDP divided by population, which gives a better picture of individual economic wellbeing.
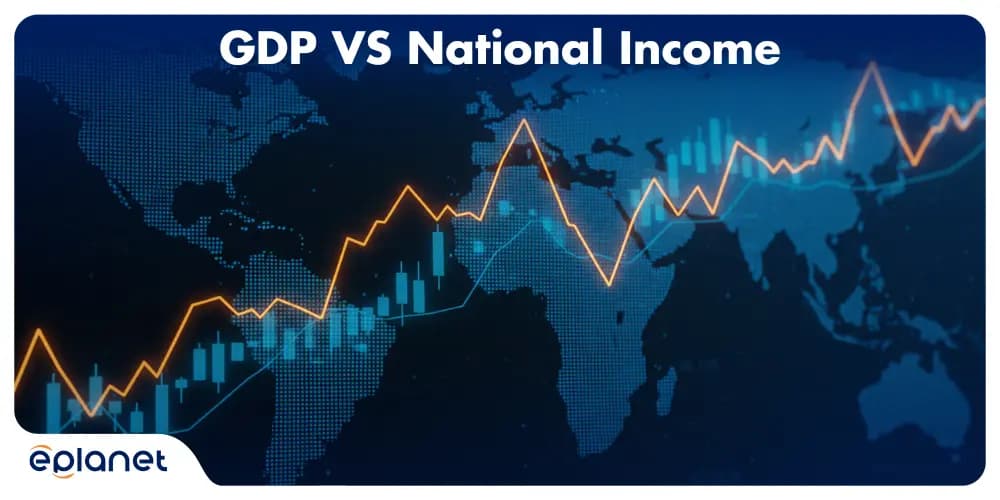
What is the Difference Between GDP and National Income?
GDP measures production, while national income measures earnings. The main difference is that GDP includes depreciation (wear and tear on capital) and indirect taxes, while national income doesn't.
For example, if a factory produces $1 million worth of goods but uses up $100,000 worth of machinery in the process, the contribution to GDP is $1 million, but the contribution to national income is $900,000.
GDP VS National Income
Who is the Largest Contributor to GDP?
In the United States, the services sector is by far the largest contributor to GDP, accounting for about 80% of economic output. This includes industries like:
- Healthcare
- Finance
- Information technology
- Professional services
- Retail trade
- Education
Manufacturing, once the backbone of the American economy, now accounts for about 11% of GDP, while agriculture contributes less than 1%.
What is the Most Powerful Country in the World?
Economic power is just one dimension of national power, but it's a critical one. The United States, with its combination of the world's largest economy, military strength, technological innovation, and cultural influence, is generally considered the most powerful country overall.
However, power is multifaceted and increasingly diffuse in today's interconnected world. China's rising economic and military might, the European Union's collective economic power, and other regional powers all shape the global landscape.
Which Country has the Most Stable Economy?
Economic stability can be measured in various ways: low inflation, steady growth, resilience to shocks, and strong institutions. By these measures, countries like Switzerland, Singapore, and the Nordic nations often rank highly for economic stability.
The U.S. economy, while powerful, experiences more volatility than some other developed economies. However, its size and diversity provide a cushion against severe downturns affecting any single sector.
Which Country has the Lowest GDP in the World?
Some of the countries with the lowest total GDP include:
- Tuvalu
- Nauru
- Kiribati
- Marshall Islands
- Palau
These are generally small island nations with limited resources and small populations.
Meanwhile, countries with the lowest GDP per capita (which measures how little economic output is available per person) include:
- Burundi
- South Sudan
- Malawi
- Central African Republic
- Niger
These countries face significant development challenges, including conflict, political instability, limited infrastructure, and other barriers to economic growth.
What is the Poorest Country in the World?
When measured by GDP per capita, Burundi is often ranked as the poorest country in the world. With a GDP per capita of less than $300, the average Burundian lives on less than a dollar a day. This stands in stark contrast to the wealthiest countries, where GDP per capita exceeds $100,000—a difference of more than 300 times.
What is the Smallest Country in the World GDP?
Tuvalu, a tiny island nation in the Pacific with a population of about 12,000 people, has the smallest GDP in the world among sovereign states. Its economy is primarily based on fishing licenses, remittances from overseas workers, and internet domain revenues (they own the lucrative .tv domain).
Frequently Asked Questions About GDP
What does GDP stand for?
GDP stands for Gross Domestic Product. It measures the total market value of all final goods and services produced within a country's borders during a specific time period, usually a quarter or a year. It is the most widely used indicator of a country's economic size and health.
What is the current U.S. GDP?
As of Q1 2026, U.S. nominal GDP is approximately $29 to $31 trillion. Real GDP grew at an annualized rate of 2.0 percent in Q1 2026, rebounding from 0.5 percent growth in Q4 2025, according to the Bureau of Economic Analysis advance estimate released in April 2026.
What is the difference between real GDP and nominal GDP?
Nominal GDP measures economic output at current prices. Real GDP adjusts that figure for inflation, showing whether the economy actually produced more goods and services or whether prices simply went up. Real GDP is the more accurate measure of genuine economic growth.
What causes GDP to fall?
GDP falls when consumer spending, business investment, government spending, or net exports decline. Common triggers include rising interest rates, high inflation that reduces purchasing power, financial crises, geopolitical shocks, or sharp drops in business confidence.
How does GDP affect Forex trading?
A higher-than-expected GDP reading typically strengthens a country's currency because it raises expectations of interest rate increases. A weaker-than-expected reading tends to weaken the currency. GDP is classified as a Tier 1 economic event, meaning it regularly triggers significant volatility across currency pairs and gold immediately after release.
What is a GDP recession?
A technical recession is defined as two consecutive quarters of negative GDP growth. However, the National Bureau of Economic Research considers a broader set of indicators — including employment, income, and industrial output — before making an official recession declaration.
Is a high GDP good or bad?
A high and growing GDP is generally a positive sign. It indicates the economy is producing more and that businesses and consumers are active. However, GDP alone does not measure inequality, environmental impact, or quality of life — which is why economists increasingly look at GDP alongside other indicators.
Which country has the highest GDP in the world?
The United States has the highest nominal GDP in the world, representing approximately 25 percent of global economic output. China holds the top position when GDP is measured by Purchasing Power Parity, which adjusts for differences in the cost of living between countries.
Conclusion
GDP is an incredibly useful tool for measuring economic activity, but it's not the be-all and end-all of economic or social well-being. As Robert Kennedy famously noted, GDP "measures everything... except that which makes life worthwhile."
Modern economists and policymakers increasingly recognize the need to look beyond GDP to measures that capture sustainability, equality, health, education, and happiness. After all, the ultimate goal of economic activity isn't just to produce more stuff, but to improve human lives.