
Forex Timeframe Mastery: Strategies for Every Trader Level
Most traders lose consistency because they focus on strategy before timeframe, when the timeframe often determines whether a setup works in the first place. In forex trading, a timeframe is the duration each candlestick represents on a chart, and choosing the right one affects everything from signal quality and stop-loss size to market noise and execution.

Key Takeaways
- Timeframe selection directly impacts your trading style – scalpers thrive on 1-5 minute charts, while position traders rely on daily and weekly timeframes.
- Higher timeframes provide stronger signals with less noise – but require more patience and larger stop losses.
- Multiple timeframe analysis creates a complete market picture – use higher timeframes for direction and lower ones for precise entries.
- Liquidity varies significantly across timeframes – major currency pairs offer better execution on shorter timeframes during active market hours.
- Your lifestyle should dictate your primary timeframe – day jobs require different approaches than full-time trading.
Introduction
Most traders who struggle with consistency are not using the wrong strategy. They are using the right strategy on the wrong timeframe.
Take a setup that produces a 70% win rate on a 5-minute gold chart. Run the same setup on a 15-minute chart and the numbers fall apart. The analysis did not get worse. The timeframe changed how much noise you absorb, where your stop sits, and how much slippage eats into your edge before price moves anywhere useful.
And this is not just a beginner mistake. Experienced traders do it too, usually mid-trade. Price moves against them, so they pull up a different timeframe looking for something that justifies staying in. One switched chart becomes a bigger loss than planned. It happens more than most traders admit.
This guide covers how different timeframes work, which ones suit which trading styles, and how to combine them so you are not remaking the same decision twice once a trade is open.
Understanding Timeframes: The Foundation of Smart Trading
What is a Timeframe in Trading?
A timeframe in forex trading represents the duration each candlestick or bar covers on your chart. Think of it as your trading telescope – adjust the lens, and you see different aspects of the same market reality. A 1-minute chart shows 1,440 candles per day, each representing one minute of price action. Meanwhile, a daily chart condenses that entire day into a single candle.
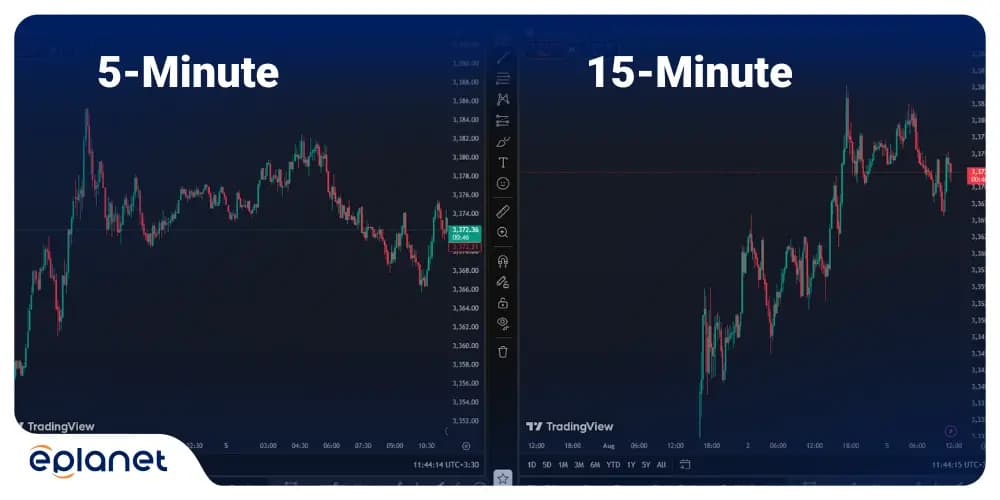
The beauty lies in how each timeframe reveals different market characteristics. I remember when I first started trading, I was glued to the 1-minute chart, trying to catch every small move. It was like trying to navigate a city by staring at my feet instead of looking at street signs. Once I learned to step back and see the bigger picture, my trading transformed completely.
What are Timeframes in Forex?
Forex timeframes range from the ultra-short tick charts to monthly views that span years of data. Here's how they break down:
Ultra-Short Timeframes (Tick to 5-minute):
- Tick charts: Real-time price changes
- 1-minute: 1,440 candles per day
- 5-minute: 288 candles per day
Short Timeframes (15-minute to 1-hour):
- 15-minute: 96 candles per day
- 30-minute: 48 candles per day
- 1-hour: 24 candles per day
Medium Timeframes (4-hour to Daily):
- 4-hour: 6 candles per day
- Daily: 1 candle per day
Long Timeframes (Weekly to Monthly):
- Weekly: 1 candle per week
- Monthly: 1 candle per month
Each category serves different trading personalities and strategies. The key is matching your timeframe to your goals, available time, and risk tolerance.
The Importance of Timeframe in Trading: Why It's Your Secret Weapon
Market Noise vs. Meaningful Signals
Let me share something that changed my trading game forever. Early in my career, I was that trader who'd see a "perfect" setup on the 5-minute chart, only to watch it get steamrolled by the opposite trend on the daily. It was like trying to swim upstream – technically possible but exhaustingly inefficient.
The importance of timeframe selection goes beyond just seeing price movements. It's about filtering market noise from meaningful signals. Higher timeframes act like noise-canceling headphones for traders – they help you focus on what matters while blocking out the distracting chatter of minor price fluctuations.
Risk Management Across Timeframes
Different timeframes require dramatically different risk management approaches. A scalper might risk 5-10 pips with a 2-3 pip profit target, while a daily chart trader might risk 100 pips for a 300-pip target. Neither approach is wrong – they're optimized for their respective timeframes.
| Timeframe | Typical Stop Loss | Typical Target | Win Rate Expectation |
|---|---|---|---|
| 1-5 minutes | 3-10 pips | 5-15 pips | 60-70% |
| 15-30 minutes | 10-25 pips | 20-50 pips | 50-60% |
| 1-4 hours | 25-75 pips | 75-200 pips | 40-50% |
| Daily+ | 75-200 pips | 200-500 pips | 35-45% |
This table illustrates a crucial trading principle: shorter timeframes typically offer higher win rates but smaller profit-to-risk ratios, while longer timeframes provide larger moves but require more patience and tolerance for drawdowns.
Best Timeframe for Scalping
The Scalper's Paradise: 1-5 Minute Charts
Scalping on short timeframes is not about catching every move. It is about waiting for one specific condition to appear, then acting without hesitation.
The 5-minute chart is the most practical timeframe for scalping gold (XAU/USD). It gives you enough price detail to time entries precisely, without the noise that makes 1-minute charts difficult to trade consistently. Some traders use the 1-minute chart for final entry timing, but the 5-minute is where the setup forms.
Here is how a real scalping setup works on this timeframe. When XAU/USD is in a bullish run making new highs, you mark last week's Higher High and draw a horizontal line at that level. As price approaches and attempts to break through during a strong bullish push, you watch for a specific signal: a bullish candle with a visible shadow on top, showing price was rejected at that level, followed by a bearish candle. You enter short at the close of that bearish candle. Stop loss goes 10 pips above the high of the shadow candle. Take profit targets 1:2 risk-to-reward.
That setup runs at approximately 70% accuracy. The reason it works is that the shadow candle reveals institutional rejection at a known level. The market tried to break through and failed, and the 5-minute chart shows that rejection clearly enough to act on it.
Prime Scalping Hours:
- London Open: 3:00-6:00 AM EST
- New York Open: 8:00-11:00 AM EST
- London-New York Overlap: 8:00 AM-12:00 PM EST
During these windows, gold and major pairs carry the tightest spreads and deepest liquidity. Outside these hours, spread widening alone can eliminate the edge on a short-timeframe setup before price moves in your direction.
Scalping Strategy Essentials
Three things determine whether a scalping timeframe actually works for you.
Spread and execution quality. On a 5-minute scalp with a 10-pip stop, a 2-3 pip spread is a significant portion of your risk. A broker with inconsistent execution or spread widening during active sessions will erode a profitable setup over time, even if the analysis is correct. This matters more on gold than on major currency pairs because XAU/USD spreads can widen fast during volatile periods.
Session timing. The same setup that produces consistent results during the London session can fail during the Asian session simply because there is not enough volume behind the moves. Scalping timeframes require active markets.
Psychological demands. Scalping is not just a technical style, it is a psychological one. You will have losses in clusters. The traders who fail at it are usually not reading the charts wrong. They are reacting to individual losses instead of treating each trade as one data point in a larger system.
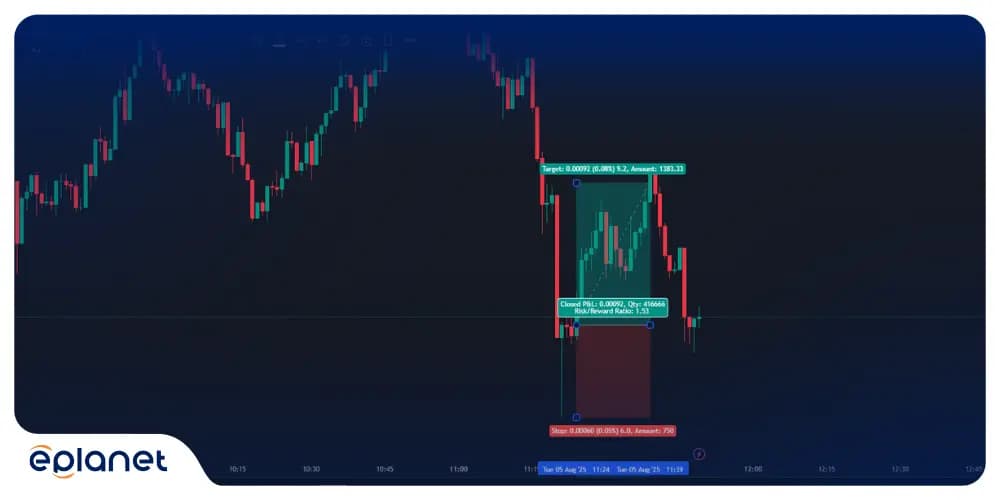
However, scalping isn't for everyone. It requires intense focus, quick decision-making, and the ability to handle rapid-fire losses without emotional distress. I've seen excellent swing traders fail miserably at scalping simply because the psychological demands were too different.
Best Timeframe for Forex Beginners
The Sweet Spot: 1-Hour and 4-Hour Charts
If you're new to forex trading, I have one piece of advice that could save you months of frustration: start with the 1-hour and 4-hour timeframes. These are the Goldilocks zones of forex trading – not too fast, not too slow, but just right for learning.
Here's why these timeframes are perfect for beginners:
Manageable Pace: Unlike scalping, you have time to think, analyze, and make decisions without panic. A trade setup on the 4-hour chart might take several hours to play out, giving you breathing room.
Clear Patterns: Technical analysis patterns are more reliable and easier to spot on these timeframes. Support and resistance levels, trend lines, and chart patterns have more significance.
Reasonable Risk: Stop losses are typically 30-80 pips, which is substantial enough to avoid getting stopped out by normal market noise but not so large that a few losses wipe out your account.
Learning Curve Advantages
When I mentor new traders, I always start them on these intermediate timeframes because they offer the best learning environment:
Mistake Recovery: If you enter a trade slightly early or late, there's often time for the market to move in your favor anyway.
Pattern Recognition: You'll develop a keen eye for setups without getting overwhelmed by the constant movement of shorter timeframes.
Risk Management Practice: You can practice position sizing and stop-loss placement without the pressure of split-second decisions.
A beginner should spend at least 3-6 months mastering these timeframes before attempting to scalp or swing trade on daily charts. Trust me, this foundation will serve you well throughout your trading career.
Timeframe and Liquidity in Trading: The Hidden Connection
Understanding Market Liquidity Across Time
Liquidity in forex isn't constant – it flows like a river, sometimes rushing, sometimes trickling. The relationship between timeframes and liquidity is one of those "aha!" moments that separate struggling traders from successful ones.
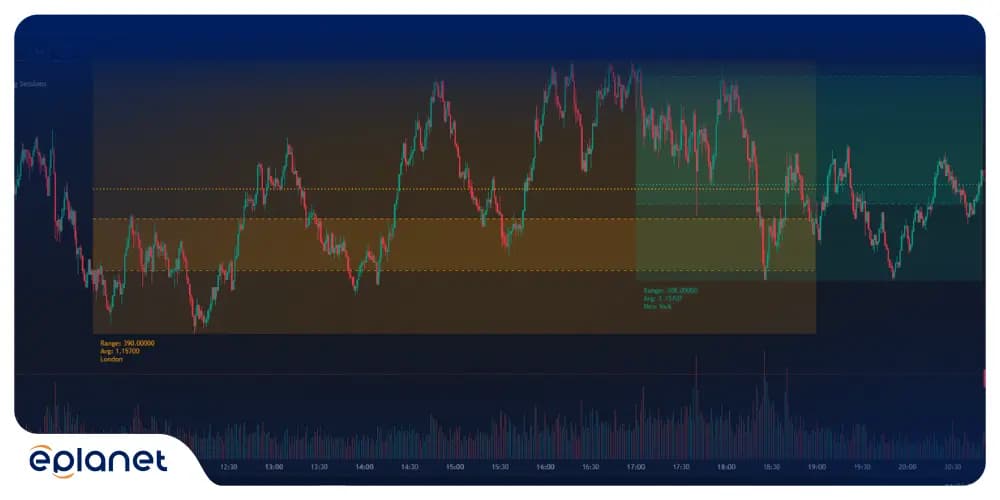
During the London session (3:00 AM - 12:00 PM EST), EUR/USD might see 10-15 pip ranges on 5-minute charts with tight spreads and instant execution. But during the Asian session, that same timeframe might show 2-3 pip ranges with wider spreads and potential slippage.
High Liquidity Periods:
- Sydney-Tokyo Overlap: 7:00 PM - 2:00 AM EST
- London Session: 3:00 AM - 12:00 PM EST
- New York Session: 8:00 AM - 5:00 PM EST
- London-New York Overlap: 8:00 AM - 12:00 PM EST (Peak liquidity)
Impact on Different Trading Styles
The liquidity-timeframe relationship affects your trading in ways you might not realize:
Scalping Impact: Low liquidity periods can turn profitable scalping strategies into break-even or losing propositions due to wider spreads and slippage.
Swing Trading Advantage: Higher timeframe traders are less affected by liquidity variations since they're looking for larger moves that transcend individual sessions.
Breakout Trading: The most reliable breakouts often occur during high-liquidity periods when there's enough volume to sustain momentum.
I learned this lesson the hard way during my second year of trading. I had a fantastic scalping strategy that worked beautifully during London hours but lost money consistently during quiet Asian sessions. The timeframe hadn't changed, but the market conditions had.
Timeframe Adjustment for News Trading
Why News Events Change the Rules on Short Timeframes
Major economic releases do not just move price. They change how your timeframe behaves in the minutes around the announcement. Spreads widen, execution slows, and stop losses can trigger at prices you never set them at. For short-timeframe traders, this is the part that actually costs money.
The standard advice is to stay out during high-impact news. That works as a starting rule. The more useful version is that your timeframe before, during, and after a release should follow a specific logic, because the market is doing three different things across those three windows.
Pre-News Setup (15-minute to 1-hour charts): In the 30 to 60 minutes before a major release, use the 1-hour chart to see where price sits relative to key levels. Not to enter. To understand where price will likely go if the number surprises, so you are not figuring that out while the candle is already moving.
News Release Reaction (1-minute to 5-minute charts): The spike is tradeable, but only if your levels were already marked before the number hit. Entering the moment the release drops, with no plan, is how traders get filled mid-spread at a price they did not intend to trade at.
Post-News Follow-through (15-minute to 4-hour charts): The move that forms a few minutes after the spike is usually the cleaner one. Moving to a 15-minute or 1-hour chart at that point tells you whether the move has legs or is already turning back.
What Actually Happens to Your Stop Loss During News
Here is a situation that is more common than most brokers discuss publicly.
A trader held a sell position on XAU/USD with 0.05 lots and a stop loss set approximately 70 pips from current price. Well outside the normal range of a brief news spike, or so it appeared. The position was open going into a Powell press conference. At the moment the conference started, the spread on gold widened aggressively. The stop loss triggered not because price reached it, but because the spread expansion pushed the effective price past the stop level. The loss came in at around $37 on a position sized conservatively for that stop distance.
After the stop triggered, price dropped sharply and moved well past where the original take profit had been set. The analysis was correct. The execution environment during the news event overrode the trade.
This is not an argument against news trading. It is an argument for managing positions manually during high-impact events rather than relying on static stops on short timeframes. On a 5-minute scalp during a quiet session, a static stop works exactly as expected. During a Powell conference or NFP release, the spread can move faster than your stop logic can account for.
The timeframe you use near news events matters less than understanding that the rules of that timeframe change temporarily when volume spikes and spreads widen.
Read More: Using the Forex Factory Calendar During a Major News Release
How to Use Multiple Timeframes in Trading
The Top-Down Analysis Method
Multiple timeframe analysis is like reading a book – you need the chapter headings (higher timeframes) to understand the story, but you also need the sentences (lower timeframes) to grasp the details. I use what I call the "Rule of Four" – analyzing four timeframes for every trade decision.
Primary Timeframe: This is where I identify the main trend and major support/resistance levels. For swing trading, this might be the daily chart.
Secondary Timeframe: One level down from primary, used to refine entries and identify intermediate patterns. For daily primary, this would be the 4-hour chart.
Entry Timeframe: Two levels down from primary, used for precise entry timing. This would be the 1-hour chart in our example.
Confirmation Timeframe: Three levels down, used for final entry confirmation and initial stop-loss placement. The 15-minute chart completes our analysis.
Practical Multi-Timeframe Strategy
Here's how I execute a typical multi-timeframe trade:
Step 1 - Weekly/Daily Analysis: I start by identifying the major trend direction and key levels. Is EUR/USD in an uptrend, downtrend, or range? Where are the significant support and resistance zones?
Step 2 - 4-Hour Refinement: On the 4-hour chart, I look for trend continuation or reversal patterns. Are we seeing higher highs and higher lows in an uptrend? Is there a potential double top forming?
Step 3 - 1-Hour Entry Setup: The 1-hour chart shows me specific entry opportunities. I'm looking for pullbacks to support in uptrends or bounces from resistance in downtrends.
Step 4 - 15-Minute Timing: Finally, the 15-minute chart helps me time my entry precisely. I want to see momentum building in my favor before pulling the trigger.
| Analysis Level | Timeframe | Purpose | Key Elements |
|---|---|---|---|
| Trend Direction | Daily/Weekly | Major trend ID | Trend lines, major S/R |
| Pattern Recognition | 4-Hour | Setup identification | Chart patterns, momentum |
| Entry Timing | 1-Hour | Precise entries | Pullbacks, breakouts |
| Fine-tuning | 15-Minute | Confirmation signals | Entry triggers, stops |
This approach has transformed my trading consistency. Instead of getting whipsawed by conflicting signals, I now have a clear hierarchy of analysis that guides every decision.
How to Choose the Right Timeframe for Trading
Matching Timeframes to Your Lifestyle
Choosing the right timeframe isn't just about trading strategy – it's about lifestyle compatibility. I've seen too many traders force themselves into timeframes that don't match their schedule or personality, leading to stress, poor decisions, and ultimately, losses.
The Full-Time Trader: If trading is your profession, you have the luxury of choice. You can scalp during high-volatility sessions, swing trade major trends, or do both. The key is specialization – master one approach before branching out.
The Part-Time Trader: Working a day job while trading requires careful timeframe selection. The 4-hour and daily charts are your best friends because:
- Positions can be managed before work and after hours
- Less screen time required for analysis
- Overnight gaps are manageable with proper position sizing
The Weekend Warrior: Limited to evenings and weekends? Focus on daily and weekly timeframes, with position entries planned during quiet Sunday sessions before the week begins.
Personality-Based Timeframe Selection
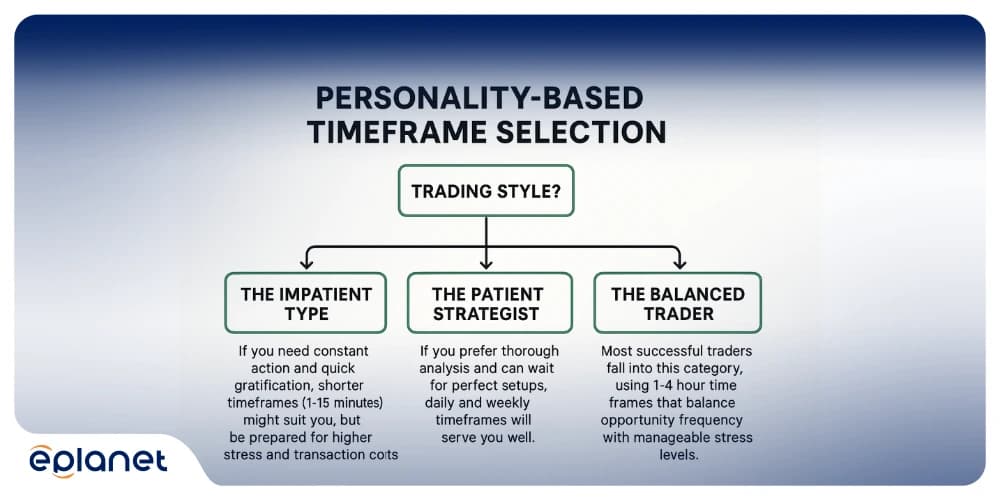
Your trading timeframe should align with your psychological makeup:
The Impatient Type: If you need constant action and quick gratification, shorter timeframes (1-15 minutes) might suit you, but be prepared for higher stress and transaction costs.
The Patient Strategist: If you prefer thorough analysis and can wait for perfect setups, daily and weekly timeframes will serve you well.
The Balanced Trader: Most successful traders fall into this category, using 1-4 hour timeframes that balance opportunity frequency with manageable stress levels.
Capital Requirements by Timeframe
Different timeframes have different capital requirements due to varying stop-loss sizes and position holding periods:
Scalping (1-5 minutes): Requires larger capital relative to position size due to tight stops and high frequency trading. Minimum recommended: $5,000.
Day Trading (15-240 minutes): Moderate capital requirements with balanced risk-reward ratios. Minimum recommended: $2,500.
Swing Trading (4-hour to weekly): Can start with smaller capital due to wider stops and better risk-reward ratios. Minimum recommended: $1,000.
The key is ensuring your timeframe choice doesn't force you into over-leveraging to generate meaningful returns.
Advanced Timeframe Strategies
The Timeframe Confluence Strategy
One of my most profitable strategies involves waiting for signals to align across multiple timeframes – what I call "timeframe confluence." When the stars align across different time horizons, the probability of success increases dramatically.
Example Setup:
- Monthly: Clear uptrend in EUR/USD
- Weekly: Pullback to rising 20-week moving average
- Daily: Bullish engulfing candle at support
- 4-Hour: Break above consolidation pattern
- 1-Hour: Momentum confirmation with RSI above 50
When all these elements align, I have tremendous confidence in the trade's probability of success. It might happen only 2-3 times per month per currency pair, but the success rate is typically above 70%.
The Fractal Nature of Markets
Markets are fractal – patterns repeat across different timeframes. A head and shoulders pattern on the 5-minute chart has the same implications as one on the daily chart, just with different profit potential and time horizons.
Understanding this fractal nature allows you to:
- Recognize patterns faster across timeframes
- Set appropriate profit targets based on timeframe
- Understand when patterns are more reliable (higher timeframes generally more reliable)
Timeframe-Specific Indicators
Different indicators work better on different timeframes:
Short Timeframes (1-15 minutes):
- Stochastic oscillator for overbought/oversold conditions
- Bollinger Bands for volatility-based entries
- Volume indicators for confirmation
Unlock the Strategy: Mastering the Best EMA for 5 Minute Charts
Medium Timeframes (30-240 minutes):
Long Timeframes (Daily+):
- Ichimoku cloud for comprehensive trend analysis
- Weekly/monthly pivots for major support/resistance
- Fundamental analysis integration
Common Timeframe Mistakes and How to Avoid Them
The Timeframe Hopping Trap
This is the mistake I see most often: traders constantly switching timeframes when their current view doesn't confirm their bias. They'll see a bullish setup on the 4-hour chart, but when it starts moving against them, they'll zoom into the 15-minute chart looking for reasons to stay in the trade.
The Solution: Establish your primary timeframe before entering any trade and stick to it. Your entry, stop-loss, and profit target should all be based on this timeframe's signals.
The Analysis Paralysis Problem
Some traders analyze so many timeframes that they never actually trade. They're waiting for all timeframes to align perfectly, which rarely happens in real markets.
The Solution: Use the "Rule of Three" – analyze only three timeframes maximum for any single trade. More than that leads to conflicting signals and delayed decisions.
The Timeframe Mismatch Error
Using indicators designed for longer timeframes on shorter charts (or vice versa) leads to false signals and poor trade timing.
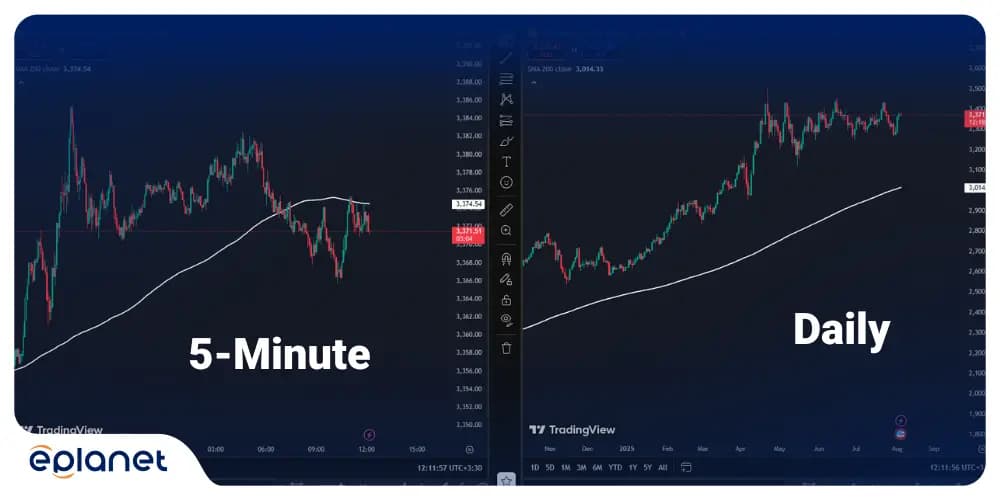
The Solution: Match your indicators to your timeframe. A 200-period moving average on a 5-minute chart represents different market information than the same MA on a daily chart.
Building Your Personal Timeframe Trading Plan
Step 1: Honest Self-Assessment
Before choosing your primary timeframes, ask yourself these critical questions:
- How much time can I realistically dedicate to trading each day?
- What's my risk tolerance for individual trades?
- How quickly do I need to see results?
- What's my available trading capital?
- Do I prefer frequent small profits or occasional large gains?
Step 2: Timeframe Selection Matrix
Based on your self-assessment, use this matrix to guide your timeframe selection:
| Trading Style | Primary Timeframe | Secondary Timeframe | Trading Frequency | Capital Required |
|---|---|---|---|---|
| Scalping | 1-5 minutes | Tick-1 minute | 10-50 trades/day | $5,000+ |
| Day Trading | 15-60 minutes | 5-15 minutes | 2-10 trades/day | $2,500+ |
| Swing Trading | 4-hour to Daily | 1-4 hours | 2-5 trades/week | $1,000+ |
| Position Trading | Daily to Weekly | 4-hour to Daily | 1-5 trades/month | $500+ |
Step 3: Testing and Refinement
Start with paper trading or micro lots to test your chosen timeframes. Track these metrics:
- Win rate by timeframe
- Average profit/loss per timeframe
- Maximum drawdown periods
- Stress levels during trading
- Time commitment required
After 2-3 months of consistent data, you'll have clear evidence of which timeframes work best for your situation.
The Psychology of Timeframe Trading
How Different Timeframes Create Different Pressure
The psychological challenge of each timeframe is not abstract. It shows up in very specific ways, and most traders do not recognize it until they have already made the mistake.
Short timeframes, anything from 1 to 15 minutes, produce constant feedback. Wins and losses come quickly. The difficulty is not the speed, it is that a losing streak of three or four trades in a row, which is completely normal at any win rate, can trigger emotional decisions that override the system entirely.
Medium timeframes, 1 to 4 hours, carry a different kind of pressure. The setup looks right, you enter, and then price moves against you for two hours before finally turning in your direction. Most traders exit during that middle period and miss the move they correctly anticipated. The challenge is not reading the chart. It is tolerating the time between entry and outcome.
Long timeframes require something most traders underestimate: the ability to hold a position through extended drawdown while staying convinced the analysis is still valid. That is harder than it sounds when real money is involved.
Read More: Trading Psychology: Master Your Mind, Master the Markets
The Mistake That Costs More Than a Bad Trade
One of the most common psychological errors in timeframe trading is switching charts after you enter a position.
The pattern goes like this. You open a short trade based on a 5-minute setup. Price moves against you. Instead of letting the stop loss do its job, you pull up the 1-hour chart looking for a reason to stay in. The 1-hour looks different, maybe even bullish. Now you are in a trade that was designed for one timeframe but is being judged by another. Your original stop loss no longer makes sense, so you move it. The loss grows.
A trader using 1-hour analysis to manage a 5-minute trade ended up with a roughly 50% account drawdown from a single position managed this way. The trade setup was not the problem. The timeframe switch after entry was.
The rule that prevents this is straightforward. Your entry timeframe, your stop loss placement, and your exit are all decided before you enter. You do not consult a different timeframe once the position is open.
The Other Side: Hesitation on Higher Timeframes
Longer timeframe traders face the opposite problem. The analysis is correct but they do not act on it.
When XAU/USD approached $2,500 for the first time, it was a clear psychological resistance level with a strong setup for a short position. A trader who had correctly identified the setup, and had even shared the analysis with others, did not enter because earlier losses that week had affected their confidence. Gold rejected sharply from that level, exactly as the analysis predicted.
The same trader then tried to find a comparable setup at $2,600 to recover the missed opportunity. That level did not carry the same weight. The trade failed and cost approximately $300.
The lesson is not that hesitation is always wrong. It is that the psychological state you are in when you look at a chart affects what you decide to do, regardless of what the chart actually shows. Higher timeframe trading gives you more time to think, and more time to talk yourself out of a correct position.
Technology and Tools for Multi-Timeframe Analysis
Essential Software Features
Modern trading platforms offer sophisticated multi-timeframe analysis tools:
Synchronized Charts: Multiple timeframes of the same pair updating simultaneously.
Alert Systems: Notifications when setups develop across different timeframes.
Custom Indicators: Tools designed specifically for multi-timeframe analysis.
Template Saving: Quickly switch between different timeframe analysis setups.
Mobile Trading Considerations
With mobile trading becoming increasingly popular, timeframe selection becomes even more critical:
Longer Timeframes Work Better: Daily and 4-hour charts are easier to analyze on small screens.
Alert Dependency: Mobile traders rely heavily on pre-set alerts for entry signals.
Simplified Analysis: Complex multi-timeframe strategies are difficult to execute on mobile devices.

Frequently Asked Questions
What timeframe should beginners start with?
New forex traders should start with 1-hour and 4-hour timeframes. These provide enough price movement to be interesting while giving you time to think and make decisions without panic. They also offer clear technical patterns that are essential for learning chart analysis. Avoid scalping timeframes until you've mastered the basics, as the speed and pressure can lead to poor decision-making and rapid account depletion.
Can you use multiple timeframes simultaneously?
Absolutely, and I highly recommend it. Professional traders typically analyze 3-4 timeframes for each trade decision. Use higher timeframes (daily/weekly) to identify trend direction and major support/resistance levels, medium timeframes (1-4 hours) to spot specific trading setups, and shorter timeframes (15-30 minutes) for precise entry timing. This approach dramatically improves your success rate by ensuring all time horizons support your trade.
How does timeframe affect stop-loss placement?
Timeframe directly influences stop-loss size and placement. Shorter timeframes require tighter stops (5-20 pips) because you're trading smaller price movements, while longer timeframes need wider stops (50-200 pips) to account for normal market volatility. The key is matching your stop-loss to the timeframe's natural price swing range. A 10-pip stop on a daily chart will get hit by normal market noise, while a 100-pip stop on a 5-minute scalp is excessive.
Which timeframe is most profitable?
There's no universally "most profitable" timeframe – profitability depends on your skill, strategy, and consistency rather than timeframe choice. However, many professional traders gravitate toward 4-hour and daily timeframes because they offer the best balance of opportunity frequency and signal reliability. These timeframes provide enough trading opportunities while filtering out much of the market noise that plagues shorter timeframes.
How do news events affect different timeframes?
Major news events create immediate volatility that affects all timeframes, but the impact varies significantly. Short timeframes (1-15 minutes) show extreme spikes and reversals during news releases, creating both opportunities and risks for scalpers. Medium timeframes (1-4 hours) often show the sustained follow-through moves after initial news reactions. Long timeframes (daily+) incorporate news effects into broader trend movements, making individual announcements less critical for position traders.
Should swing traders use intraday timeframes?
Swing traders should use intraday timeframes for entry timing and trade management, even though their main analysis occurs on daily and weekly charts. For example, a swing trader might identify a setup on the daily chart but use the 1-hour chart to pinpoint the optimal entry point during a pullback. This multi-timeframe approach improves entry prices and reduces risk while maintaining the swing trading strategy's core principles.
Conclusion
Understanding the concept of timeframes in the Forex market is a lot more than just choosing a few charts to analyze – it’s about developing a trading rhythm, selecting a trading system that matches your lifestyle and, more importantly, grasping how time affects every single bit of your trading analysis.
There is no single best time frame for any given trader. They are dependent on a number of factors including the amount of time a trader has available, their risk profile, the amount of capital that they are trading with, and their overall psychological make up. I see very few traders who have truly mastered a single time frame before moving on to others.
Finally, bear in mind that there are three core principles regarding timeframes: higher timeframes will generally provide a trader with a clearer idea of the market’s overall direction. Lower timeframes offer up precise entry points for the highest amount of profit in the shortest possible time, and by utilizing a number of timeframes in conjunction with each other, the trader can arrive at a far more complete picture of any given market.