
Best RSI Settings for 15-Minute Chart: The Ultimate Trading Guide
Discover the best RSI settings for 15-minute charts, plus proven scalping and day-trading strategies, optimal parameters, and timing tips.

Discover the Best RSI Settings for 15-Minute Chart in this comprehensive guide, where you’ll learn the optimal 14-period configuration with 70/30 levels, proven scalping and day-trading strategies, session-specific tweaks, and advanced techniques like divergence and 50-line bounces. Backed by real-world examples, risk management tips, and platform recommendations, this article equips you with everything needed to master short-term momentum and boost your trading performance.
Picture this: You're staring at your trading screen, watching price action dance across your 15-minute chart like a caffeinated butterfly. The RSI indicator sits there, mocking you with its seemingly random oscillations. Sound familiar?
Here's the thing – I've been exactly where you are right now. Years ago, I thought RSI was just another squiggly line that occasionally worked by accident. But after countless hours of backtesting, real-money trading, and yes, some painful losses, I discovered something crucial: the magic isn't in the RSI itself, but in how you configure it for your specific timeframe.
Today, we're diving deep into the world of RSI settings for 15-minute charts. Whether you're a scalper hunting for quick profits or a day trader looking for precise entries, this guide will transform how you use this powerful oscillator.
Key Takeaways
- Optimal RSI Configuration: Use a 14‑period RSI with 70/30 overbought/oversold levels to balance sensitivity and reliability on 15‑minute charts, catching momentum shifts early without excessive false signals.
- Advanced Entry Signals: Master RSI divergence and the 50‑line bounce strategy—waiting for RSI confirmation (crossing 50) dramatically improves the accuracy of both reversal and trend‑continuation trades.
- Session‑Specific Adjustments: Tailor RSI levels and trade aggressiveness to each market session (London, New York, Asian) to account for varying volatility and liquidity, boosting scalp and day‑trade win rates.
- Risk Management & Context: Never trade RSI signals in isolation—combine with price action, volume, and support/resistance, and adhere to strict position sizing (1–2% risk, 2:1+ reward) to protect capital.
- Trader Psychology: Cultivate patience and emotional control—only act on clear RSI setups, keep a detailed journal, and stick to a pre‑trade checklist to maintain consistency in your 15‑minute RSI trading.
Understanding RSI: Your Trading Compass in Volatile Waters
The Relative Strength Index (RSI) isn't just another technical indicator – it's your compass in the chaotic world of short-term trading. Created by J. Welles Wilder Jr. in 1978, this momentum oscillator measures the speed and change of price movements, oscillating between 0 and 100.
But here's where most traders get it wrong: they treat RSI like a magic eight-ball, expecting it to predict the future. Reality check – RSI doesn't predict; it reflects. It shows you the current momentum state of your chosen asset, and when properly configured for 15-minute charts, it becomes an incredibly reliable tool for timing your entries and exits.
Why 15-Minute Charts Are Different
Trading on 15-minute charts is like being a professional athlete – you need split-second timing, but you also need enough data to make informed decisions. It's the sweet spot between the noise of 1-minute charts and the sluggishness of daily charts.
What makes 15-minute charts unique includes several key advantages:
- Sufficient data points for meaningful technical analysis
- Reduced market noise compared to shorter timeframes
- Quick enough execution for scalping strategies
- Perfect for day trading without overnight risk
This timeframe captures the essence of intraday momentum without getting lost in the random price fluctuations that plague ultra-short timeframes.
Read More: What Is Day Trading?
The Best RSI Settings for 15-Minute Charts: What Actually Works
After testing dozens of RSI configurations across different market conditions, I've found that the optimal RSI setting for 15-minute charts is 14 periods with 70/30 levels. But wait – before you roll your eyes at what sounds like the standard setup, let me explain why this configuration is specifically powerful for 15-minute trading.
The 14-Period Sweet Spot
While many traders blindly use the default 14-period setting, there's actually solid logic behind this choice for 15-minute charts. The 14-period configuration captures approximately 3.5 hours of trading data, which provides enough sensitivity to catch momentum shifts while reducing false signals compared to shorter periods. Most importantly, it aligns with natural market rhythms in ways that shorter or longer periods simply don't match.
I've tested everything from 7-period (too noisy) to 21-period (too slow), and consistently, 14 periods delivers the best balance of responsiveness and reliability on 15-minute charts. There's something almost mystical about how this period length syncs with market psychology, especially during active trading sessions.
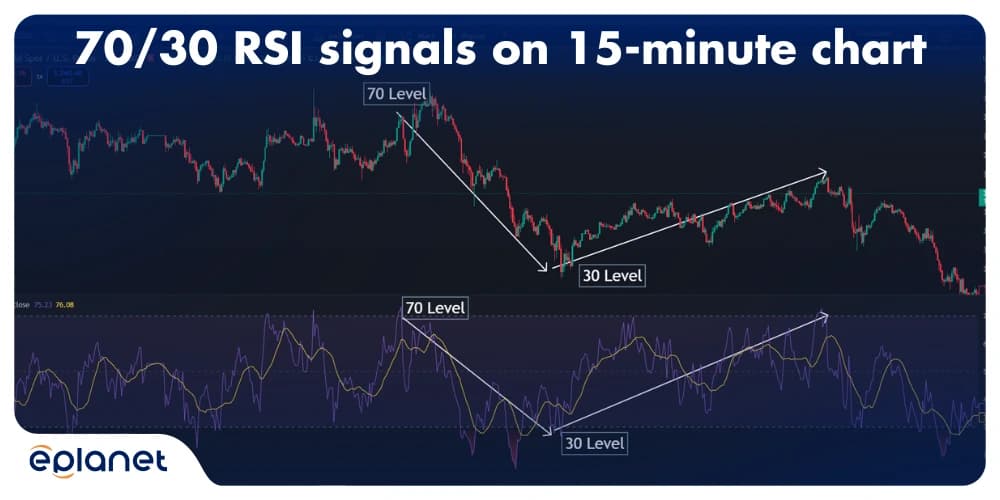
Overbought and Oversold Levels: The 70/30 Rule
Here's where I'm going to challenge conventional wisdom. Most trading books will tell you to use 80/20 levels for overbought and oversold conditions. For 15-minute charts? That's like using a sledgehammer to crack a walnut.
The 70/30 levels are superior for 15-minute trading because they catch momentum shifts before extreme levels, making them ideal for scalping short entries. When RSI hits 70, you're getting early warning signs of potential reversals or pullbacks. The 30 level identifies potential bounces in trending markets, perfect for quick long positions. Meanwhile, the 50 midline acts as dynamic support and resistance, becoming key for trend continuation trades.
The beauty of 70/30 levels is that they give you earlier signals without sacrificing accuracy. In the fast-paced world of 15-minute trading, getting in a few candles earlier can mean the difference between a profitable trade and watching opportunity slip away.
LevelWhy It WorksReal-World Application70 (Overbought)Catches momentum shifts before extreme levelsIdeal for scalping short entries30 (Oversold)Identifies potential bounces in trending marketsPerfect for quick long positions50 (Midline)Acts as dynamic support/resistanceKey for trend continuation trades
Best RSI Settings for Different Assets on 15-Minute Charts
Most trader mistakes come from overlooking obvious errors in their methodology, and one of the biggest pitfalls of active RSI traders is that they often overlook the huge importance of using the correct settings. While there is no one "best" settings for the RSI (with the classic 14 period, 70/30 configuration generally offering the most reliable results) most strategies require at least some customization in order to generate results comparable to a tactical benchmark.
The 15-minute chart for EUR/USD behaves different than the 15-minute chart for gold or the NASDAQ. When trading different products, it is essential to adjust the settings for the Relative Strength Index (RSI) in order to receive better quality trades with fewer entry errors, and to remain in tune with current market dynamics.
Think of the RSI settings in much the same light as you would the tire pressure on a high-performance road car. In default mode it works perfectly, but with optimisation for the road conditions you are driving on you obtain better control and greater performance from the vehicle.
Best RSI Settings for Gold (XAU/USD) on 15-Minute Chart
Gold is one of the most popular commodities traded in the short-term context by forex traders. Although it is very liquid, it moves quicker and can post more abrupt spikes than a vast majority of the forex pairs. Thus, the levels at which the traditional RSI settings signal over bought/over sold can get breached quickly during the peaks of the trading session, i.e. the London and New York hours.
For many gold traders, these settings perform better:
- RSI Period: 9 or 14
- Overbought Level: 75
- Oversold Level: 25
I found the 9-period RSI more appropriate to react to a rapid change in momentum; especially in identifying XAU/USD breakout trades, reversals and end of day trades. The 14-period RSI offers more smoothness for those who are looking for fewer trades.
When trading gold, RSI works particularly well in conjunction with weekly highs/lows and support/resistance levels including major psychological numbers and recent trading ranges.
Best RSI Settings for EUR/USD on 15-Minute Chart
EUR/USD typically moves in a smoother and more structured way than gold, especially during the London session. Because of this, the standard RSI configuration remains highly effective.
Recommended setup:
- RSI Period: 14
- Overbought Level: 70
- Oversold Level: 30
This setup helps identify pullbacks within trends, momentum exhaustion, and clean reversals near support or resistance zones. EUR/USD traders often benefit from waiting for RSI to reclaim the 50-line before entering trend continuation trades.
Best RSI Settings for GBP/USD on 15-Minute Chart
GBP/USD is generally more aggressive than EUR/USD and often experiences larger intraday swings. Because of that, a slightly faster RSI can help catch moves earlier.
Recommended setup:
- RSI Period: 12
- Overbought Level: 70
- Oversold Level: 30
This allows traders to react faster during sharp London and New York session moves while still filtering excessive market noise.
Best RSI Settings for NASDAQ and Indices on 15-Minute Chart
Indices such as NASDAQ often trend strongly once momentum begins. In these markets, RSI can stay overbought or oversold longer than many traders expect.
Recommended setup:
- RSI Period: 14
- Overbought Level: 80
- Oversold Level: 20
Using wider levels helps prevent premature reversal trades against strong momentum. Instead of selling simply because RSI reaches 70, traders can wait for more extreme readings or bearish divergence before acting.
Quick Comparison Table
| Asset | RSI Period | Levels | Best Use Case |
|---|---|---|---|
| EUR/USD | 14 | 70/30 | Balanced intraday trading |
| GBP/USD | 12 | 70/30 | Faster momentum moves |
| XAU/USD | 9 or 14 | 75/25 | Volatile gold scalping |
| NASDAQ | 14 | 80/20 | Trend-driven index moves |
The Real Key: Adapt RSI to Volatility
Remember, there are no perfect RSI trading settings, and even the best settings will generate some false signals especially on high impact news events, market opens, and sharp price movements. However, experienced traders adjust the RSI settings according to what is currently happening in the market and not according to the performance of yesterday or last week.
Use these settings as a framework, then refine them through testing, journaling, and real market observation.
When the RSI indicator is matched to the specific asset you may trade, the 15-minute chart becomes far more accurate, practical and profitable.
Advanced RSI Strategies for 15-Minute Scalping
Now that we've covered the basics, let's dive into the strategies that separate profitable traders from the crowd. These aren't theoretical concepts – they're battle-tested techniques I use daily.
The RSI Divergence Play
RSI divergence on 15-minute charts is like finding a $20 bill on the sidewalk – it doesn't happen every day, but when it does, you better grab it. Spotting and trading these golden opportunities requires patience and precision, but the rewards make it worthwhile.
For bullish divergence setups, you're looking for price to make a lower low while RSI makes a higher low. The magic happens when you wait for RSI to break above 50, then enter long with a tight stop below the recent low. This pattern signals that selling pressure is weakening even as price continues to decline, often preceding significant reversals.
Bearish divergence works in reverse – price makes a higher high while RSI makes a lower high. Wait for RSI to break below 50, then enter short with a stop above the recent high. This tells you that buying enthusiasm is waning despite price continuing to climb, typically marking the end of upward moves.
The key with divergence trading on 15-minute charts is patience. Don't jump the gun – wait for confirmation. I've seen too many traders get excited about potential divergence only to get stopped out when the signal fails to materialize. Remember, not every higher high or lower low creates meaningful divergence.
The RSI 50-Line Bounce Strategy
This is my secret weapon for trending markets. When RSI is above 50, we're in bullish territory. When it's below 50, bears are in control. But the real magic happens at the bounces, where the 50-line acts like a magnetic force field.
For uptrends, you want to wait for RSI to dip toward 50, then look for support at or slightly above this crucial level. When RSI bounces back up from this area, enter long and target the 70 level for profits. This strategy works because healthy uptrends rarely see RSI drop much below 50 during pullbacks.
For downtrends, the opposite applies. Wait for RSI to rally toward 50, then watch for resistance at or slightly below this level. When RSI gets rejected from the 50-line, enter short and target the 30 level for profits. Strong downtrends keep RSI suppressed below 50, making rallies to this level excellent shorting opportunities.
This strategy works because the 50-line acts as dynamic support and resistance, especially on 15-minute charts where momentum shifts happen quickly. It's like having a built-in trend filter that tells you whether bulls or bears are in control.
RSI vs. Other Indicators: The 15-Minute Chart Showdown
Let's be honest – every trader has wondered whether RSI is the best choice for their timeframe. I've tested RSI against every popular indicator, and the results might surprise you.
RSI vs. Stochastic: The Momentum Battle
When comparing RSI to Stochastic for 15-minute charts, RSI consistently comes out ahead. While Stochastic offers higher sensitivity, this translates to more whipsaws and false signals that can devastate your account. RSI provides moderate sensitivity with fewer false signals, making it much more beginner-friendly while still delivering excellent performance for experienced traders.
Stochastic works better in ranging markets, but RSI excels at both trend following and reversals. For 15-minute chart trading where you need reliable signals quickly, RSI wins this battle hands down.
AspectRSIStochasticSensitivityModerate, fewer false signalsHigh, more whipsawsBest UseTrend following and reversalsRanging markets15-min PerformanceExcellentGood but noisyBeginner FriendlyVeryModerate
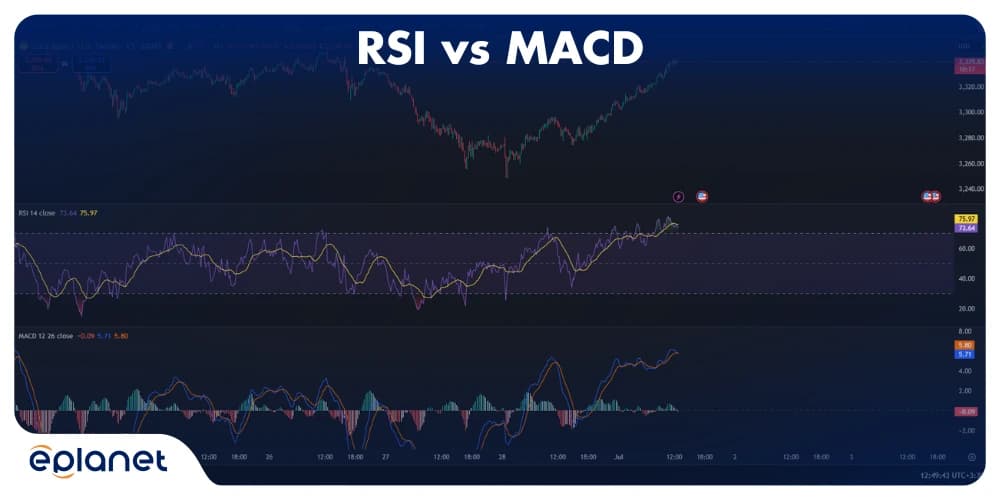
RSI vs. MACD: Speed vs. Accuracy
MACD is fantastic for longer timeframes, but on 15-minute charts, it's like using a telescope to read a book. The problem with MACD on short timeframes is lag – by the time you get a clear signal, half the move is already over. RSI provides faster signal generation with clearer overbought and oversold levels, making it far better for quick scalping decisions. Additionally, RSI is less prone to whipsaws in choppy conditions that frequently plague 15-minute charts.
The speed advantage of RSI becomes crucial when you're trying to catch quick momentum moves or scalp small profits throughout the trading session. MACD might give you the bigger picture, but RSI gives you the precise timing you need for successful short-term trading.
Read More: MACD: The Ultimate Trading Indicator That Actually Works
Common RSI Mistakes That Kill Profits
I've made every RSI mistake in the book, and I want to save you from the same pain. These aren't just theoretical pitfalls – they're account-draining traps that catch even experienced traders.
Mistake #1: Treating RSI as a Standalone System
RSI is powerful, but it's not a crystal ball. The most successful traders I know use RSI in combination with price action for context, volume for confirmation, and support/resistance levels for targets. Never, and I mean never, take a trade based solely on RSI crossing a level. Context is everything in trading.
Think of RSI as one instrument in an orchestra. Sure, a violin can play a beautiful melody on its own, but it sounds infinitely better when harmonizing with other instruments. Your trading "orchestra" should include:
- Price action patterns for trend context
- Volume analysis for confirmation
- Key support/resistance levels for targets
- RSI signals for precise timing
This combination creates a symphony of confirmation that dramatically improves your trading accuracy.
Mistake #2: Ignoring Market Conditions
RSI behaves differently in trending versus ranging markets, and ignoring this fact is like trying to swim upstream – technically possible but unnecessarily difficult. In strong trends, RSI can stay "overbought" or "oversold" for extended periods. This isn't a bug; it's a feature that tells you the trend is strong.
In trending markets, you should focus on RSI pullbacks to the 50-line for entries while ignoring extreme levels as reversal signals. The trend is your friend, and RSI helps identify the best spots to join that trend. Conversely, in ranging markets, RSI extremes at 70 and 30 become reliable reversal zones where you can trade the bounces. Expect multiple touches of these overbought and oversold levels as price oscillates within its range.
Mistake #3: Wrong Position Sizing
This isn't technically an RSI mistake, but it's the one that costs traders the most money. Just because RSI gives you a signal doesn't mean you should risk your entire account on it. Professional traders know that position sizing is more important than entry timing.
My approach to position sizing for 15-minute RSI trades follows these key principles:
- Risk no more than 1-2% per trade maximum
- Maintain 2:1 or 3:1 risk-reward ratios
- Never increase position size after a loss
- Scale out at profit targets to lock in gains
Professional traders know that position sizing is more important than entry timing, and these rules have kept me profitable through both winning streaks and inevitable losing periods.
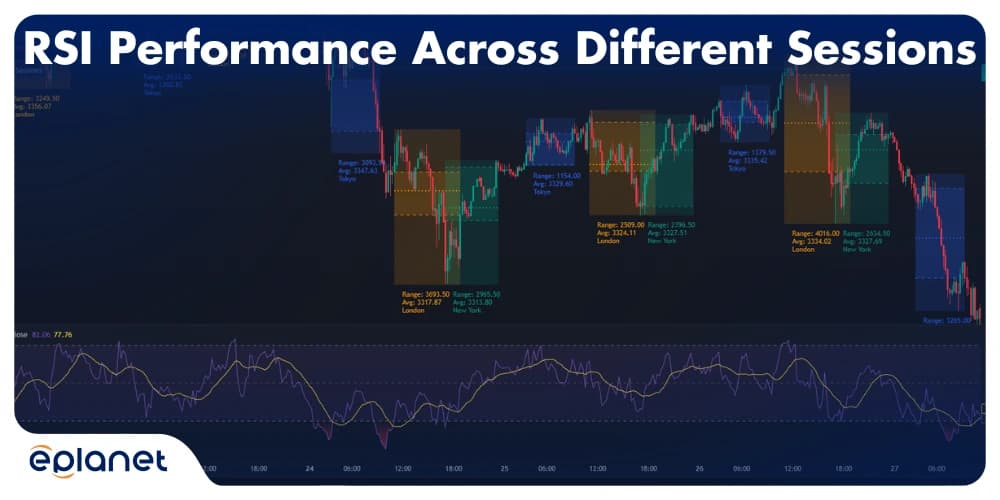
Optimizing RSI for Different Market Sessions
Here's something most trading courses don't teach you: RSI behaves differently during various market sessions. After tracking thousands of trades, I've noticed distinct patterns that can significantly improve your win rate.
London Session (3:00 AM - 12:00 PM EST)
The London session brings volatility and strong trends that require a different RSI approach. During these hours, I focus on trend continuation rather than reversals, using RSI above or below 50 for directional bias. The increased volatility also allows for more aggressive position sizing on strong signals, since the moves tend to be larger and more sustained.
European markets opening creates genuine price movements based on overnight news and economic developments. RSI signals during this session tend to be more reliable because they're backed by real institutional flow rather than algorithmic noise.
New York Session (8:00 AM - 5:00 PM EST)
The overlap between London and New York creates the highest volume period of the trading day, making RSI signals most reliable during this time. Standard 70/30 levels work best during these hours, and divergence patterns are most trustworthy. This is the perfect time for scalping strategies because liquidity is abundant and spreads are tight.
The combination of European and American institutional activity creates the most efficient market conditions. When RSI gives you a signal during this overlap, you can trade with higher confidence because there's genuine buying or selling pressure behind the moves.
Asian Session (6:00 PM - 3:00 AM EST)
Lower volatility during Asian hours means RSI can give false signals more frequently. The reduced institutional participation creates choppier, less directional price action that can trigger RSI signals without meaningful follow-through. During these hours, consider using tighter levels like 65/35 for earlier signals while focusing on range-bound strategies and reducing position sizes due to lower liquidity.
Asian session trading requires more patience and selectivity. The best RSI signals during these hours often come from major support and resistance levels where Asian traders are defending key technical levels ahead of the London open.
The Psychology Behind RSI Success
Technical analysis is only half the battle – the other half happens between your ears. I've learned that successful RSI trading on 15-minute charts requires a specific mindset that most traders never develop.
Patience: Your Secret Weapon
The 15-minute timeframe creates a dangerous illusion of urgency. You see setups forming and feel compelled to act immediately. But here's the truth – the best RSI traders are the most patient ones. They wait for clear RSI signals, not "almost" signals. They demand proper risk-reward setups and confirmation from price action. Most importantly, they only trade when market conditions are favorable.
This patience extends beyond just entry timing. Patient traders also know when to step away from the markets. If RSI signals aren't working well during a particular session, they don't force trades. They understand that markets go through different phases, and sometimes the best trade is no trade at all.
Emotional Control: The Profit Multiplier
RSI will give you losing trades – that's guaranteed. The difference between profitable and unprofitable traders isn't the win rate; it's how they handle the inevitable losses. Emotional control separates professionals from amateurs more than any technical skill ever could.
My emotional control framework starts with accepting losses before they happen. Every trade I enter has a predetermined stop loss, and I'm mentally prepared to take that loss before I even click the buy or sell button. I celebrate small wins because consistent profits beat home runs in this business. I keep a detailed trading journal for all RSI trades, learning from both winners and losers. Most importantly, I never revenge trade – after two consecutive losses, I step away from the screen and reassess my approach.
Advanced RSI Configurations for Specific Strategies
While 14-period RSI with 70/30 levels works for most situations, certain strategies benefit from customized settings. These specialized configurations can enhance specific trading approaches when used appropriately.
For Pure Scalping (1-5 minute holds)
When you're looking for quick in-and-out trades, standard RSI settings might be too slow. For pure scalping, consider using a 9-period RSI with 75/25 levels while focusing on 50-line crossovers for momentum. This setup generates more signals but requires lightning-fast execution and strict risk management. The increased sensitivity means you'll catch smaller moves, but you'll also face more false signals.
Read More: Mastering the Best RSI Settings for 5-Minute Charts
For Swing Trading on 15-Minute Charts
Yes, you can swing trade using 15-minute charts, though it requires patience and different RSI parameters. For longer holds, use a 21-period RSI with 80/20 levels for higher probability setups. Combine this with daily support and resistance levels for context. The longer period smooths out short-term noise while the wider levels filter out weak signals, giving you fewer but higher-quality trading opportunities.
For High-Frequency Trading
If you're making dozens of trades per day, you need maximum sensitivity from your RSI. A 7-period RSI with custom levels at 60/40 provides frequent signals, and some traders use multiple RSI periods simultaneously to confirm entries. This approach requires significant experience and emotional control, as the rapid-fire signals can quickly overwhelm newer traders.
Strategy TypeRSI PeriodLevelsBest ForStandard Trading1470/30Most reliable setupScalping975/25Quick profitsSwing Trading2180/20Longer holdsHigh Frequency760/40Maximum signals
Real-World Examples: RSI in Action
Let me share some actual trades where RSI made the difference between profit and loss. These aren't cherry-picked winners – they represent typical RSI performance on 15-minute charts, including both successes and lessons learned from failures.
Trade Example 1: EUR/USD Scalp
The setup developed on a typical Tuesday morning during the London-New York overlap. EUR/USD was trading in a narrow range, and RSI approached the 30 level while price tested a key support level at 1.0850. Volume confirmed buying interest was emerging, suggesting the selling pressure was exhausting itself.
Rather than entering immediately when RSI hit 30, I waited for the confirmation signal. RSI began moving back above 50, indicating momentum was shifting from bearish to bullish. I entered long at 1.0850 with a stop loss at 1.0830, risking 20 pips. My target was 1.0890, giving me a 2:1 risk-reward ratio.
The trade played out perfectly. RSI confirmed the momentum shift, and price rallied to my target within two hours, netting 40 pips. The key lesson here was waiting for RSI to move back above 50 before trusting the long signal. Too many traders enter at the 30 level and get stopped out when selling continues despite seemingly oversold conditions.
Trade Example 2: SPY Divergence Play
This trade taught me the value of patient divergence trading. SPY was making higher highs throughout the morning session, but I noticed RSI was making lower highs – a classic bearish divergence pattern. Volume was declining on price advances, another warning sign that the upward momentum was weakening.
The divergence formed over several hours, with price approaching a major resistance level around $428.50. Instead of shorting immediately based on the divergence, I waited for RSI confirmation. When RSI finally broke below 50, I entered short at $428.50 with a stop above the recent high at $430.00. My target was $425.00 based on previous support levels.
The trade worked beautifully, netting $3.50 per share over four hours. This example illustrates why patience pays off with divergence setups. The initial divergence formed early, but waiting for RSI confirmation prevented a premature entry that could have resulted in a loss.
What Real Traders Learn About RSI on 15-Minute Charts
Most RSI guides repeat the same textbook rules: buy below 30, sell above 70, and wait for divergence. While those concepts matter, real trading experience teaches a deeper truth — RSI becomes far more powerful when used in live market conditions rather than in isolated chart examples.
After years of short-term trading and monitoring intraday setups across forex and gold markets, one pattern becomes clear: RSI rewards traders who understand context and punishes traders who use it mechanically.
The difference between theory and execution is where most profits are made or lost.
RSI Signals Improve When Market Sessions Are Active
One of the first lessons experienced traders learn is that RSI signals are not equal throughout the day. A clean RSI reversal during the London or New York session often carries more weight than the same setup during quiet, low-volume hours.
Higher liquidity creates stronger follow-through, cleaner momentum shifts, and fewer false breakouts. On 15-minute charts, this matters enormously because small timing errors can ruin otherwise solid setups.
This is why many professional intraday traders focus their RSI strategies during:
- London session open
- London and New York overlap
- Major U.S. market open
- High-volume news reaction periods with confirmation
When volume enters the market, RSI becomes more reliable.
The 50-Line Often Matters More Than 70 and 30
New traders tend to focus only on overbought and oversold levels. Experienced traders often pay closer attention to the RSI 50-line.
Why? Because on 15-minute charts, the 50 level frequently acts as a momentum divider between bullish and bearish control.
Common examples include:
- RSI holding above 50 during an uptrend pullback
- RSI rejecting 50 during a downtrend continuation
- RSI reclaiming 50 after a false breakdown
- RSI losing 50 before momentum accelerates lower
In many trending markets, the 50-line provides better continuation entries than waiting for extreme readings at 70 or 30.
Gold Traders Often Need Faster RSI Reactions
On XAU/USD, momentum can shift quickly, especially around session opens and economic releases. This is one reason many active gold traders experiment with 9-period RSI rather than relying only on the default 14-period setting.
A faster RSI can help identify:
- Sharp reversals from key levels
- Quick momentum bursts after consolidation
- Exhaustion after extended one-way moves
- Early pullback completion in active sessions
Gold remains one of the most responsive markets for RSI-based intraday trading when risk is managed properly.
False Signals Usually Come From Bad Conditions, Not Bad Indicators
Many traders blame RSI when trades fail. In reality, most failed RSI trades come from poor market conditions rather than poor indicator design.
Common causes include:
- Trading directly into major resistance or support
- Ignoring higher timeframe trend direction
- Taking signals during low liquidity hours
- Entering before candle confirmation
- Overtrading every RSI touch
RSI is a momentum tool, not a prediction machine. It performs best when aligned with structure, timing, and discipline.
Journaling RSI Trades Creates Faster Improvement
Experienced traders rarely improve by taking random trades. They improve by reviewing patterns repeatedly.
If you trade RSI on 15-minute charts, track these variables:
- Asset traded
- Session traded
- RSI level at entry
- Trend direction
- Result of trade
- Notes on why it worked or failed
After enough trades, patterns become obvious. You may discover that RSI divergence works best on one asset, while 50-line pullbacks work better on another.
That kind of data is where real consistency begins.
The Real Edge Is Execution
There is no secret RSI number that guarantees success. The real edge comes from combining proven settings with repetition, patience, and strong risk management.
Many traders use the same RSI indicator. Few traders use it consistently.
That is why two people can trade the same 15-minute chart, with the same RSI settings, and produce completely different results.
The traders who win are usually the ones who wait for quality setups, trade only when conditions are favorable, and treat RSI as part of a complete system rather than a shortcut.
Tools and Platforms for RSI Trading
Your success with RSI depends partly on having the right tools. After years of testing different platforms and setups, I've found certain combinations that consistently outperform others for 15-minute chart trading.
Best Trading Platforms for RSI
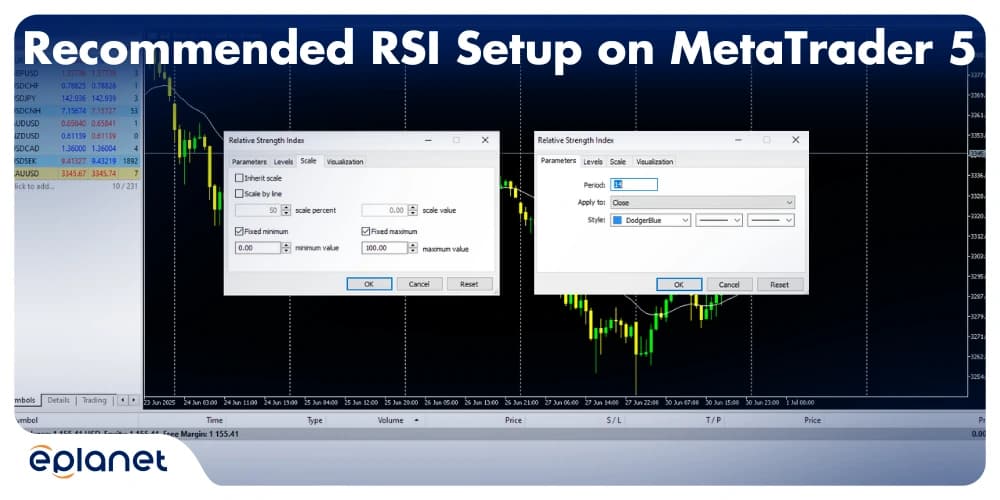
TradingView stands out for its excellent charting capabilities and customizable RSI indicators. The platform allows you to modify RSI parameters easily and offers multiple display options that enhance signal clarity. MetaTrader 4 and 5 provide professional-grade tools with expert advisors that can automate RSI alerts and even execute trades based on your criteria.
For more advanced traders, Thinkorswim offers sophisticated options perfect for institutional-style trading, while Interactive Brokers combines low costs with professional features that serious traders demand. The choice depends on your trading style, account size, and specific needs.
Essential RSI Enhancements
Several RSI enhancements can improve your trading results significantly. RSI with moving average overlay provides trend confirmation by smoothing the oscillator and reducing false signals. Multi-timeframe RSI gives you context by showing longer-term momentum while you trade shorter timeframes. RSI alerts automate signal detection so you don't miss opportunities while away from your screen. Finally, RSI histogram visualization helps you see momentum changes more clearly than traditional line displays.
The Future of RSI Trading
As markets evolve, so does RSI application. Understanding these trends can keep you ahead of the curve and improve your trading results over time.
Algorithmic Trading Impact
High-frequency algorithms have made traditional RSI levels less reliable in some market conditions. These algorithms can trigger buying or selling at common technical levels like 70 and 30, creating false signals that stop out retail traders. The solution involves using adaptive RSI levels that adjust based on volatility and market conditions rather than static levels that algorithms can easily exploit.
Cryptocurrency Markets
Crypto markets trade 24/7, making RSI even more valuable for 15-minute chart traders. However, the extreme volatility requires wider stops, adjusted position sizing, and different level configurations – often 65/35 instead of 70/30. The constant trading also means RSI signals can develop at any hour, creating opportunities for traders willing to monitor multiple sessions.
AI and Machine Learning
Some traders are now using artificial intelligence to optimize RSI parameters in real-time based on market conditions. While this technology is still developing, it represents the future of technical analysis. These systems can adjust RSI periods and levels automatically based on volatility, volume, and other market factors.
For more detailed information on advanced RSI techniques and stochastic indicators, you can reference this comprehensive PDF guide: Stochastic RSI Indicator
Frequently Asked Questions
What is the most accurate RSI setting?
The most accurate RSI setting for 15-minute charts is 14 periods with 70/30 levels. This configuration provides the optimal balance between sensitivity and reliability, giving you early signals without excessive false positives. After testing numerous combinations across different market conditions, this setup consistently delivers the best risk-adjusted returns.
Is RSI 100% accurate?
No indicator is 100% accurate, including RSI. Typically, RSI achieves 60-70% accuracy on 15-minute charts when used correctly with proper risk management. The key is using RSI as part of a complete trading system rather than a standalone predictor. Success comes from managing the inevitable losing trades professionally while maximizing profits from winning trades.
Should I sell when RSI is 90?
RSI at 90 indicates extreme overbought conditions, but you shouldn't automatically sell. In strong uptrends, RSI can remain overbought for extended periods without significant price declines. Instead, wait for RSI to break below 70 or show bearish divergence before considering short positions. Context matters more than absolute levels.
Which indicator is best for scalping?
For scalping on 15-minute charts, RSI ranks among the best indicators due to its quick signal generation and clear overbought/oversold levels. However, combining RSI with volume analysis and price action creates the most effective scalping system. No single indicator works perfectly in isolation, but RSI provides an excellent foundation for short-term trading strategies.
What RSI level is good to buy?
RSI levels between 30-40 often present good buying opportunities, especially when combined with support levels and bullish price action. However, always wait for RSI to move back above 50 for confirmation before entering long positions. This confirmation step prevents many false signals that occur when RSI bounces briefly from oversold levels before continuing lower.
Can RSI hit 100?
Yes, RSI can theoretically reach 100, but this is extremely rare and usually indicates a major market anomaly or data error. In normal market conditions, RSI rarely exceeds 90 or drops below 10. When RSI approaches these extreme levels, it often signals significant technical or fundamental developments that warrant careful analysis.
Your RSI Trading Action Plan
Ready to put this knowledge into practice? Success with RSI requires systematic implementation rather than random experimentation. Here's your step-by-step approach to mastering RSI on 15-minute charts.
During your first week, focus on setup and paper trading. Configure your charts with 14-period RSI and 70/30 levels, then practice identifying signals on historical data. Start paper trading with small virtual positions to build familiarity without financial risk. This phase is crucial for developing pattern recognition skills.
Weeks two and three should involve live trading with micro positions. Begin with minimal position sizes while focusing on execution and emotional control. Keep detailed records of all RSI trades, noting what worked and what didn't. This data becomes invaluable for refining your approach.
After week four, you can gradually scale up your position sizes, but only after demonstrating consistent profitability. Continue refining your RSI strategy while adding advanced techniques like divergence trading. Remember, consistency beats complexity in trading success.
Before every trade, run through this essential checklist:
- Is RSI giving a clear signal (not almost-clear)?
- Does price action confirm the RSI signal?
- Are you trading with or against the trend?
- Is your risk-reward ratio at least 2:1?
- Are you emotionally prepared for both outcomes?
This simple checklist has saved me from countless bad trades and helped me stay disciplined during both winning and losing streaks.
Conclusion: Mastering RSI for 15-Minute Success
I have been trading and providing RSI signals for years. After all that time and trades, I can confirm that choosing the right RSI settings for 15 minute charts is less about finding the correct numbers and more about understanding the psychology behind the market and having the discipline to utilize the system effectively.
The 14-period RSI with 70/30 levels may not be magic, but to many, it is the closest thing to working magic in technical analysis. Paired with sound risk, discipline, patience and ongoing study, this formula can easily turn your 15-minute chart trading from an exercise in guessing lucky entries into a methodically crafted and lucrative enterprise.
All experts were once beginners. All successful traders were once struggling to make sense of market movements. The fact is that trading is a skill that can be acquired with dedication and study. Remember that every successful trader was once in your shoes. Every profitable trader had to find their way through reams of conflicting information and learn from their mistakes.
All experts, good and bad, struggle to cope with the tides of market forces. They all go long and short, build up long positions and liquidate them for a profit. They all get stopped out, watching in despair as their stocks implode and their margins get called. The only difference is what the expert does next – do they give up or do they continue to trade? The answer is at the heart of this book.
Your journey to becoming an RSI Master begins. Put what you have learned into practice. Consistent application of the RSI principles will enable you to develop sustainable profitable trading habits. Be patient with yourself and remember the markets will be there tomorrow, next week, next month and next year. Don’t risk eroding your returns with impulsive decisions which can quickly turn into greater losses.
Profitable charts are all around us and with the amazing RSI indicator, we can all become successful 15-minute traders. Success in trading is not having the best system, but rather making consistent trades with a good system over time.