
How to Identify Breaker Blocks in Forex Trading in 2025 for Smarter Entries
Master breaker block trading in forex with this guide, covering high-probability setups and profitable trade execution for traders.

Have you ever watched the forex market suddenly reverse direction and wondered, "How did I miss that?" I've been there too. Years ago, while trading EUR/USD, I kept getting caught on the wrong side of major price movements until I discovered breaker blocks. This powerful yet underutilized strategy completely transformed my approach to the markets.
Breaker block trading isn't just another technical pattern, it's a crucial component of smart money analysis that we've explored extensively in our main Smart Money Concepts guide. As part of our comprehensive smart money series, this article focuses specifically on breaker blocks, one of the most powerful tools for understanding institutional behavior.
Key Takeaways
- Breaker blocks are powerful forex reversal patterns where previous support becomes resistance (bearish) or previous resistance becomes support (bullish), signaling high-probability trading opportunities.
- Smart money traders use breaker blocks to identify institutional positioning - this ICT (Inner Circle Trader) concept helps retail traders spot where large market participants are likely placing orders.
- Trading breaker blocks effectively requires proper identification - look for price breaking through a significant level, then returning to test that level from the opposite side with a clear rejection.
- Combine breaker blocks with other technical tools like EMAs, RSI divergence, and multi-timeframe analysis to increase trading success and confirm higher-probability setups.
- Implement strategic risk management when trading breaker blocks - place stops beyond the zone, limit risk to 1-2% per trade, and use multiple profit targets to secure gains while allowing for extended moves.
What is a Breaker Block?
A breaker block is a powerful price action pattern that signals potential market reversals or continuations. It represents a zone where previous support turns into resistance, or previous resistance transforms into support. This phenomenon occurs when price breaks through a significant level and later returns to test this level from the opposite side.
Think of it like this: when a fortress wall (support/resistance) is breached, that broken wall often becomes a strategic position for the opposing force. In market terms, once buyers break through a resistance level, sellers often regroup at that same level when price returns to it.
The beauty of breaker blocks lies in their simplicity and effectiveness. They don't require complex indicators or formulas – just a keen eye for price action and market structure.

Breaker Block ICT: Understanding the Inner Circle Trader Approach
If you've researched breaker blocks, you've likely encountered the term "ICT" or Inner Circle Trader. This approach to breaker blocks, popularized by trader Michael J. Huddleston, offers a more nuanced understanding of market structure and order flow.
The ICT methodology approaches breaker blocks as part of a larger market structure framework, focusing on institutional order flow and "smart money" concepts. According to this approach, breaker blocks represent areas where large institutional traders set positions, making them particularly significant.
Key elements of the ICT breaker block approach include:
- Identifying optimal trade location (OTL)
- Recognizing fair value gaps (FVG)
- Understanding liquidity pools and their relationship to breaker blocks
- Utilizing market structure shifts to confirm breaker block validity
While traditional breaker block analysis is powerful on its own, incorporating ICT concepts can provide deeper insights into why these patterns work and how institutional traders might be positioning themselves around these levels.
ICT Breaker Block PDF
Many traders search for comprehensive resources on breaker blocks, often looking for PDFs that explain the ICT methodology in detail. While I can't provide a direct download, I can recommend researching ICT's materials on breaker blocks, which typically cover:
- Advanced order flow concepts
- Market structure analysis
- Institutional perspectives on price action
- Specific entry and exit techniques
For those interested in exploring the ICT approach in greater detail, numerous resources are available online, including the ICT breaker block PDF documents that outline this methodology comprehensively.
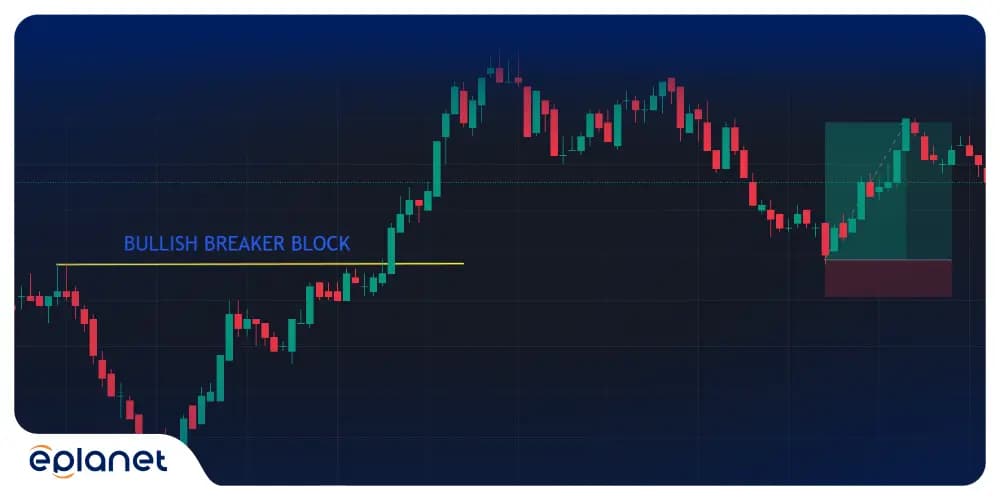
Bullish Breaker Block
A bullish breaker block forms during an uptrend and signals potential buying opportunities. Let me walk you through how to identify one:
- First, look for a strong bullish move that creates a new high
- Then, the price pulls back, creating a lower low
- Price then rallies again, breaking above the previous high
- Finally, price retraces to test the broken resistance (now support), this is your bullish breaker block
This pattern indicates that previous resistance has now become support, suggesting a continuation of the upward movement.
What fascinates me about bullish breaker blocks is how they capture the psychology of market participants. When price returns to test the broken resistance, many traders who missed the initial breakout are eager to enter, creating buying pressure. Meanwhile, sellers who shorted at the previous high are facing losses and may close positions, adding to the upward momentum.
Bullish Breaker Block Example
Let me share a real-world example to illustrate this concept better:
Imagine EUR/USD is in an uptrend. The price rallies from 1.0800 to 1.0850, then pulls back to 1.0820. It then surges to 1.0880, breaking the previous high. After this breakout, the price retraces to test the 1.0850 level; this is your bullish breaker block zone. Many traders would look to enter long positions around 1.0850, with a stop loss below 1.0820.
What makes this setup so powerful is the clear risk-reward ratio it offers. Your entry is at a level with demonstrated significance, your stop loss is logical (below the recent low), and your profit target can be projected based on the previous swing's magnitude.
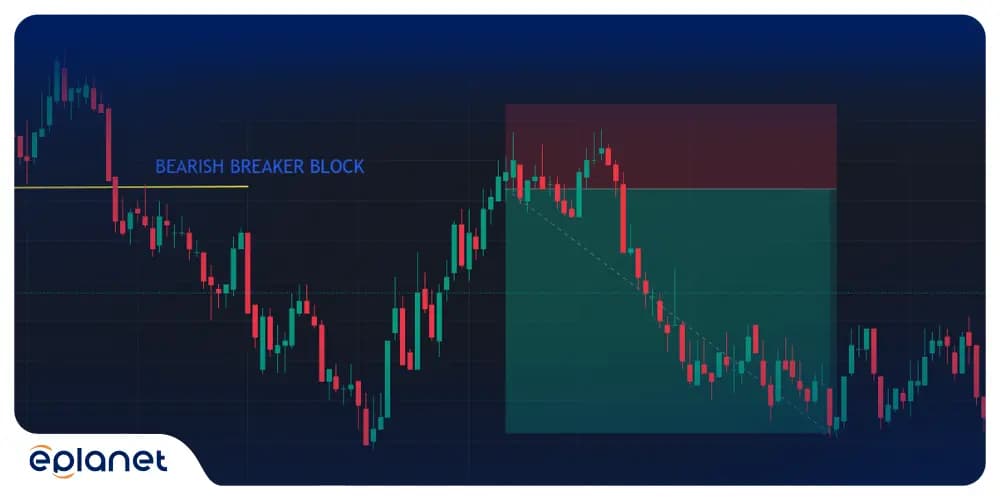
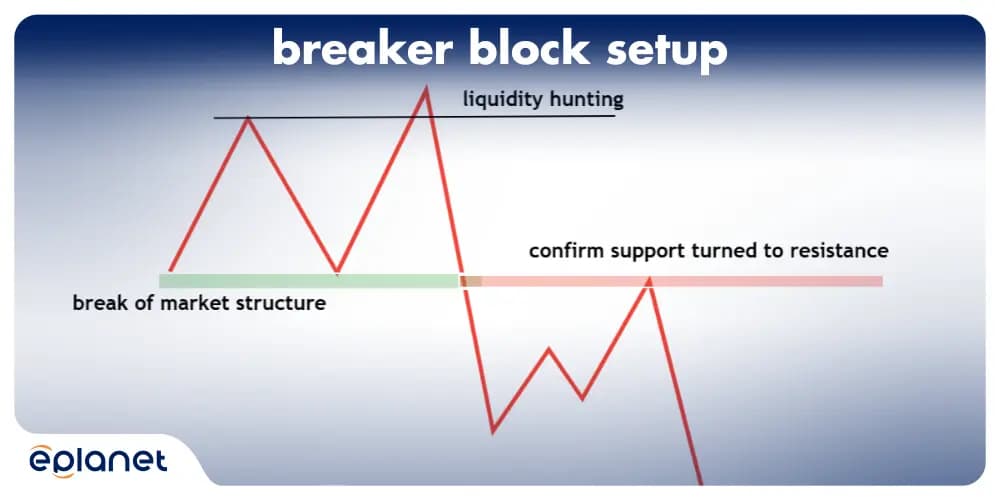
Bearish Breaker Block
Conversely, a bearish breaker block forms during a downtrend and signals potential selling opportunities. Here's how to spot one:
- Look for a strong bearish move creating a new low
- Price then bounces, creating a higher high
- Price drops again, breaking below the previous low
- Price retraces to test the broken support (now resistance), this is your bearish breaker block
This pattern suggests that previous support has transformed into resistance, indicating a likely continuation of the downward movement.
The psychology behind bearish breaker blocks is equally compelling. When price returns to test the broken support, traders who missed the initial breakdown see a second chance to sell. Simultaneously, buyers who went long at the previous support are facing losses and may exit positions, contributing to downward pressure.
Bearish Breaker Block Example
Let's look at a practical example:
In a USD/JPY downtrend, the price drops from 145.00 to 144.50, then bounces to 144.70. It subsequently falls to 144.30, breaking the previous low. When the price retraces to test the 144.50 level, that’s your bearish breaker block zone. This area presents an opportunity to enter short positions, with a stop loss above 144.70.
What I appreciate most about trading bearish breaker blocks is how they allow me to join significant downtrends at optimal entry points, rather than chasing the market after a big move has already occurred.
What is the Difference Between Bullish and Bearish Breaker Block?
The fundamental difference between bullish and bearish breaker blocks lies in their market context and formation:
AspectBullish Breaker BlockBearish Breaker BlockMarket DirectionForms in uptrendsForms in downtrendsFormationPrevious resistance becomes supportPrevious support becomes resistanceEntry SignalBuy at retest of broken resistanceSell at retest of broken supportStop Loss PlacementBelow recent lowAbove recent highProfit TargetAbove previous highBelow previous lowPsychologyBuyers see opportunity, trapped sellers exitSellers see opportunity, trapped buyers exit
What surprised me when I first studied these patterns was how similar yet distinct they are. Both represent the market testing previous key levels, but the context completely changes the trading approach. Understanding this distinction is crucial for proper implementation.
Breaker Block Examples
Let's explore some real-world examples to better understand how breaker blocks appear and function across different forex pairs.
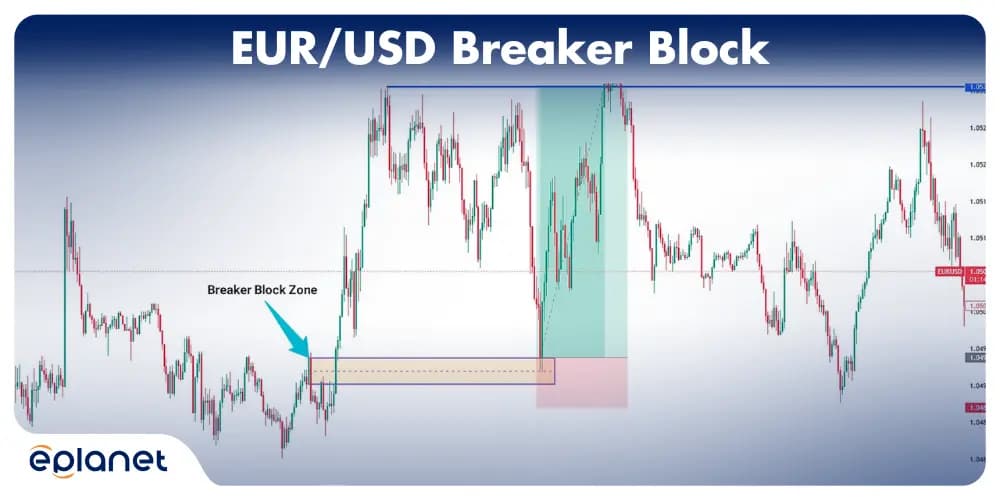
Example 1: EUR/USD Daily Timeframe
On the EUR/USD daily chart, a significant support level at 1.0750 was broken to the downside after a period of consolidation. Three weeks later, price retraced back to this level, which now functioned as resistance. This bearish breaker block led to a continued move downward, offering a high-probability short opportunity.
Example 2: USD/JPY 4-Hour Timeframe
In this example, USD/JPY broke above a resistance level at 145.00 with strong momentum. When price later pulled back to this level, it bounced precisely from 145.00, confirming a bullish breaker block. The pair subsequently continued its upward movement, gaining over 300 pips from the breaker block level.
Example 3: AUD/USD Weekly Timeframe
On a larger timeframe, AUD/USD demonstrated how breaker blocks can indicate major trend reversals. After breaking a multi-year support level, price later retraced to test this level as resistance. The rejection from this breaker block signaled the start of a new downtrend that lasted for several months.
These examples illustrate the versatility of breaker blocks across different timeframes and market conditions. Whether you're a day trader working with 15-minute charts or a position trader using weekly timeframes, breaker blocks can be incorporated into your analysis framework.
Breaker Block Trading for Different Market Conditions
One of the strengths of breaker block trading is its adaptability to various market environments. Here's how to adjust your approach:
Trading Breaker Blocks in Trending Markets
In strong trends, look for breaker blocks that align with the trend direction. These typically offer the highest probability setups with excellent risk-reward profiles.
Trading Breaker Blocks in Ranging Markets
In sideways markets, breaker blocks often form at the range boundaries. Trading rejections from these levels can be effective, but use tighter stops as false breakouts are more common.
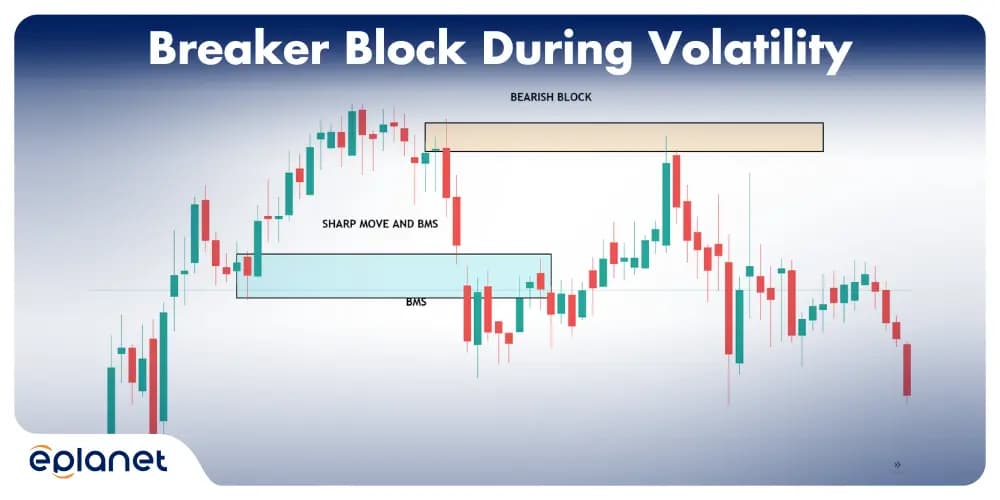
Trading Breaker Blocks During Volatility
During high-volatility periods (such as major news releases), consider waiting for the market to stabilize before trading breaker blocks, or adjust your position sizing to account for wider stops.
Seasonal Considerations
Certain times of year, such as December holiday periods or summer months in major financial centers, can affect breaker block reliability due to reduced liquidity. Adjust expectations and position sizing accordingly.
Advanced Breaker Block Trading Strategies
For experienced traders looking to take their breaker block trading to the next level, consider these advanced strategies:
Nested Breaker Blocks
Look for breaker blocks that form within larger breaker block zones. These "nested" patterns often provide exceptionally high-probability trade opportunities due to the confluence of multiple levels.
Breaker Block Failure Strategy
When a breaker block fails (price breaks through instead of rejecting), this often signals a particularly strong move in the opposite direction. Trading these failures can be highly profitable when done with proper risk management.
Time-Based Filtering
The timing of breaker block formation and retesting significantly impacts reliability. Blocks that form during high-liquidity hours and are retested during similar conditions tend to be more reliable than those that form during quiet market periods.
Volume Profile Analysis
Incorporating volume profile analysis with breaker blocks helps identify which zones have true institutional interest versus those that may be more easily broken.
By mastering these advanced concepts, you can develop a sophisticated breaker block trading approach that adapts to changing market conditions and provides consistent results.
How to Trade Using Breaker Blocks
Now that we understand what breaker blocks are and how to identify them, let's discuss how to effectively incorporate them into your trading strategy. Here's my personal approach:
Entry Strategies
- Direct Entry: Enter immediately after price rejects from the breaker block level. This provides the best risk-reward ratio but requires confidence in your analysis.
- Confirmation Entry: Wait for an additional confirmation signal, such as a bullish or bearish candlestick pattern, before entering. This reduces false signals but may result in less favorable entry prices.
- Limit Order Approach: Place limit orders at the breaker block level in anticipation of price reaching and respecting this zone. This allows for passive entries with optimal pricing.
Stop Loss Placement
Proper stop loss placement is crucial when trading breaker blocks:
- Place stops beyond the breaker block zone, typically 10-15 pips beyond the furthest point of the zone
- Consider volatility-based stops that account for the pair's average movement
- Use the structure of the breaker block itself to determine logical stop placement
Take Profit Targets
For profit targets, consider these approaches:
- Previous swing points in the direction of your trade
- Fibonacci extension levels (127.2%, 161.8%)
- Risk-reward based targets (2:1, 3:1, etc.)
- Multiple partial targets to secure profits while allowing for extended moves
Risk Management
I cannot stress enough the importance of proper risk management when trading breaker blocks:
- Limit risk to 1-2% of your trading capital per trade
- Consider reducing position size on counter-trend breaker blocks
- Implement partial profit-taking to reduce exposure as the trade develops
- Adjust stops to breakeven after the trade moves in your favor by a predetermined amount
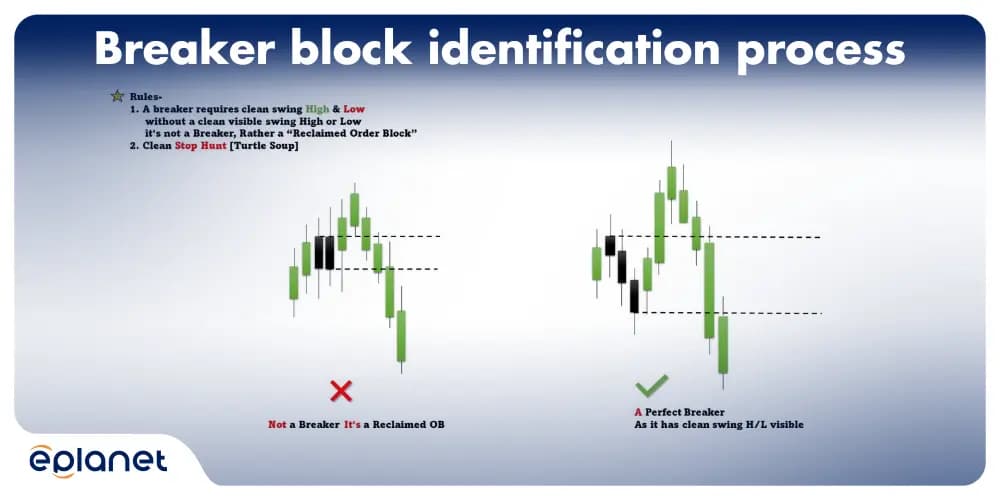
How to Identify Breaker Block in Forex?
Identifying breaker blocks in the forex market requires attention to detail and an understanding of price action fundamentals. Here's my step-by-step approach:
- Identify significant support and resistance levels: Look for areas where price has repeatedly bounced or rejected. These are your potential breaker block zones.
- Watch for a decisive break: The price must clearly break through the level with conviction, preferably with increased volume or momentum.
- Wait for retracement: After the breakout, price should retrace back to the broken level.
- Observe the reaction: When price returns to the broken level, watch how it reacts. A rejection from this level confirms the breaker block.
- Consider the context: Breaker blocks are more reliable when they form in the direction of the larger trend or at key market turning points.
I remember one particularly effective breaker block I spotted on the GBP/USD daily chart. After a prolonged downtrend, price broke above a major resistance level with substantial volume. Two weeks later, when price retraced to this level, it held perfectly as support, leading to a 500-pip rally. These are the kinds of opportunities breaker blocks can reveal when identified correctly.
How to Use Breaker Block?
Beyond the basic trading approach, here are some advanced techniques for utilizing breaker blocks effectively:
Integration with Other Technical Tools
Breaker blocks become even more powerful when combined with other technical analysis methods:
- Moving Averages: Look for breaker blocks that align with key moving averages like the 50 EMA or 200 SMA
- RSI Divergence: Breaker blocks that form with RSI divergence often indicate stronger reversal potential
- Support/Resistance: Breaker blocks that coincide with historical support/resistance levels or round numbers have increased significance
- Trend Lines: When breaker blocks form at the intersection of important trend lines, their validity is often enhanced
Read More: How EMAs Can Help Identify Trends and Opportunities
Timeframe Analysis
I've found that multi-timeframe analysis significantly improves breaker block trading success:
- Identify the breaker block on your preferred trading timeframe
- Confirm the pattern on higher timeframes for direction bias
- Use lower timeframes for precise entry timing
- Consider only trading breaker blocks that align across multiple timeframes
Market Context Consideration
Always evaluate breaker blocks within the broader market context:
- Economic calendar events can strengthen or invalidate breaker blocks
- Market sentiment and risk appetite affect how breaker blocks play out
- Correlation with related markets (indices, commodities) can provide additional confirmation
- Liquidity conditions impact the reliability of breaker block formations
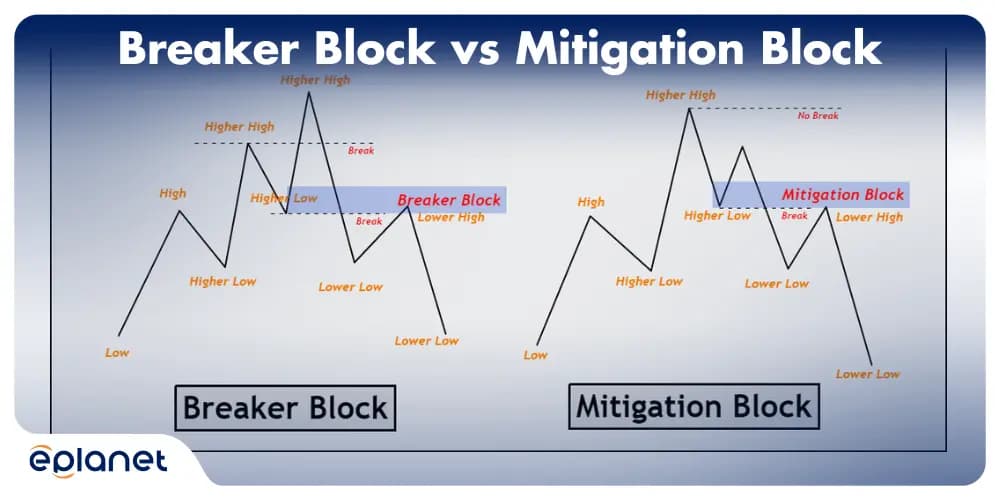
What is the Difference Between Breaker Block and Mitigation Block?
Traders often confuse breaker blocks with mitigation blocks, but they represent different concepts:
AspectBreaker BlockMitigation BlockDefinitionArea where previous support/resistance is broken and retestedArea where orders are filled before a significant moveFormationRequires a break of a key level and return to that levelForms before a strong directional moveFunctionActs as new support/resistance after a breakRepresents absorption of orders before continuationTrading ApproachEnter on the retest of broken levelEnter after the mitigation is completeRisk ManagementStop beyond recent swing pointStop beyond the mitigation block
While both concepts revolve around price returning to previous levels, they serve different analytical purposes. Breaker blocks focus on the psychological aspect of broken levels, while mitigation blocks concentrate on market efficiency and order flow dynamics.
Understanding both concepts provides a more complete picture of market structure and can help inform more sophisticated trading decisions.
Read More: What is a Mitigation Block
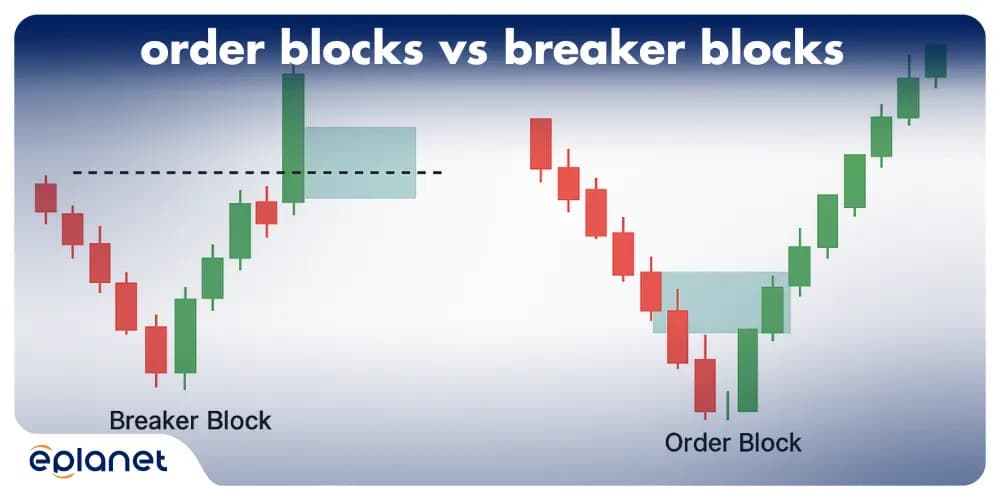
What is the Difference Between Order Block and Breaker Block in Forex?
Another common source of confusion is the distinction between order blocks and breaker blocks. Let's clarify:
AspectOrder BlockBreaker BlockDefinitionThe last opposing candle before a strong momentum moveArea where previous support/resistance is broken and retestedIdentificationFocus on the origin of a moveFocus on broken levels being retestedApplicationOften used as entry zonesUsed as entry zones after confirmationTimingForm before a major moveForm after a level is brokenTheoretical BasisRepresents institutional order placementRepresents market structure shift
While both concepts can be used complementarily, they represent different approaches to understanding market structure. Some traders actually combine these concepts, looking for order blocks within breaker block zones for even more precise entry opportunities.
Read More: What is Order Block in Trading?
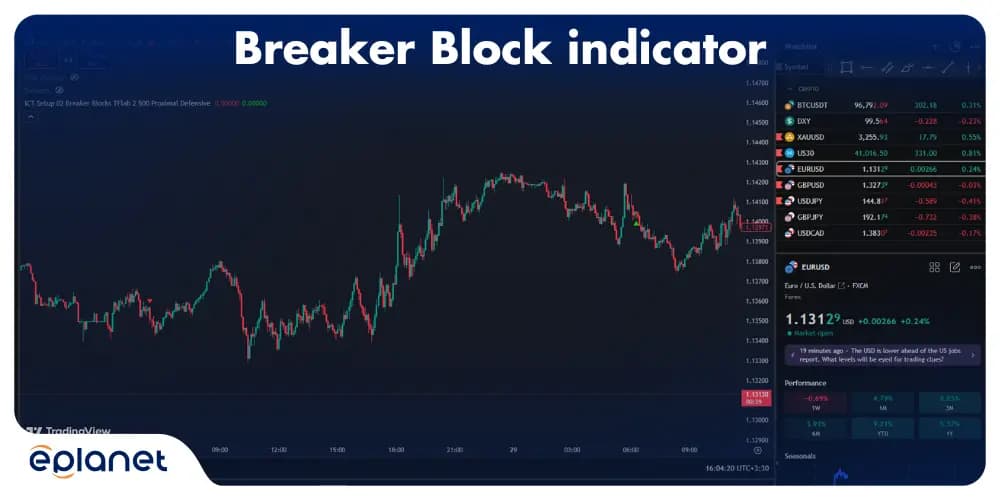
What is the Breaker Block Indicator in Tradingview?
While breaker blocks are traditionally identified through manual chart analysis, several Tradingview indicators have been developed to help automate this process:
- ICT Breaker Blocks Indicator: This popular indicator automatically identifies potential breaker block zones based on price action analysis. It highlights these areas on your chart, making pattern recognition more efficient.
- Smart Breaker Block Scanner: This indicator not only identifies breaker blocks but also rates them based on quality factors like volume, momentum, and alignment with larger trends.
- Breaker Block Alert System: For traders who prefer notifications, this indicator provides alerts when price approaches identified breaker block zones.
While these tools can be helpful, especially for beginners, I recommend learning to identify breaker blocks manually first. This builds a deeper understanding of market structure and helps you recognize nuances that automated indicators might miss.
Most Tradingview breaker block indicators can be customized to adjust sensitivity, timeframe preferences, and visual presentation. Experimenting with these settings can help you find the configuration that best suits your trading style.
Frequently Asked Questions (FAQ)
What is Breaker Block in SMC?
In Smart Money Concepts (SMC), breaker blocks play a central role in understanding institutional order flow. SMC traders view breaker blocks as visual representations of where “smart money” (institutional traders) is likely to place orders.
Are breaker blocks reliable for trading?
Breaker blocks can be highly reliable when used correctly and combined with other forms of analysis such as market structure, liquidity, and confirmation signals. Their effectiveness increases when they align with the overall trend and are supported by confluence factors like fair value gaps, RSI divergence, or higher timeframe levels.
What timeframe is best for trading breaker blocks?
Breaker blocks can be identified on all timeframes, from lower timeframes like 5-minute charts to higher timeframes such as daily or weekly charts. However, higher timeframe breaker blocks generally provide stronger and more reliable signals, while lower timeframes are often used for precise entry and exit timing.
What is the difference between a breaker block and an order block?
A breaker block forms after a key support or resistance level is broken and then retested, indicating a shift in market structure. In contrast, an order block represents the last opposing candle before a strong directional move and is typically used to identify the origin of institutional orders. While both concepts are related, they serve different roles in technical analysis.
Can beginners trade using breaker blocks?
Yes, beginners can trade using breaker blocks, but it is important to first understand basic concepts such as support and resistance, trend direction, and risk management. Starting with simple setups, such as trading breaker blocks in the direction of the trend and waiting for confirmation, can help improve consistency and reduce risk.
Why do breaker blocks fail?
Breaker blocks can fail due to several factors, including weak market structure, lack of confirmation, low liquidity conditions, or strong opposing momentum. False breakouts and ranging market conditions can also reduce their effectiveness. This is why combining breaker blocks with proper risk management and additional confirmation tools is essential.
Conclusion
Breaker blocks represent one of the most powerful yet underutilized concepts in forex trading. By understanding how previous support and resistance levels can reverse roles after being broken, you gain insight into market psychology and institutional behavior that few retail traders possess.
Whether you're a novice trader looking for a reliable strategy or an experienced professional seeking to enhance your technical toolkit, breaker blocks offer valuable insights into market behavior. The concepts discussed in this guide, from basic identification to advanced applications, provide a comprehensive framework for implementing this approach in your trading.
The Bottom Line
Remember that consistent success requires practice, patience, and discipline. No strategy works perfectly in all market conditions, but breaker block trading offers a versatile approach that can be adapted to various environments and combined with other technical methods.
I encourage you to study the examples provided, practice identifying these patterns on historical charts, and gradually incorporate them into your trading plan. With time and experience, you may find that breaker blocks become an invaluable part of your forex trading journey.