
Fair Value Gap (FVG) Explained: The Complete Trading Guide for 2026
When these gaps appear on a chart, and then get filled, many traders find them to be mysterious and often very powerful trading signals. These so-called Fair Value Gaps or Trading Gaps present a unique void or empty space in the price pattern of a market. They can even appear to happen out of nowhere, which can make for a sometimes dramatic entry or exit point for a trade. Today we’re going to take a look at this important concept.

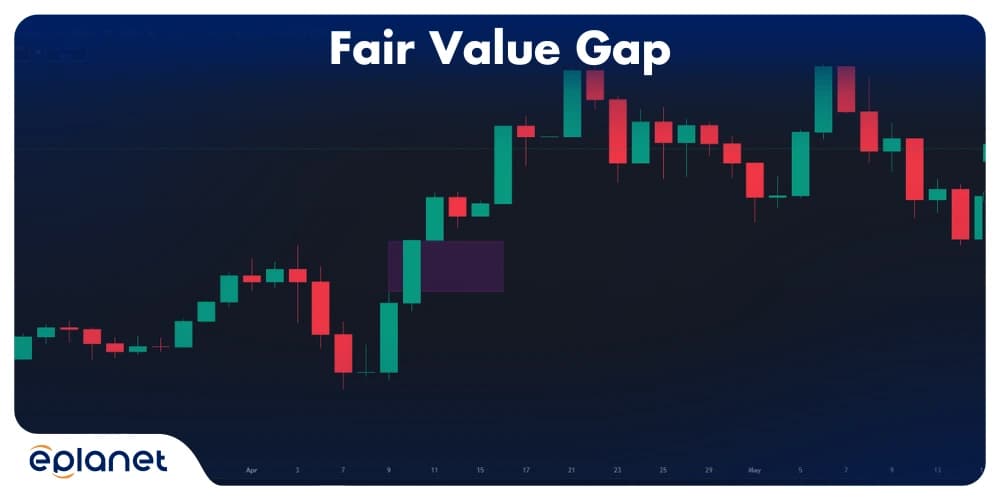
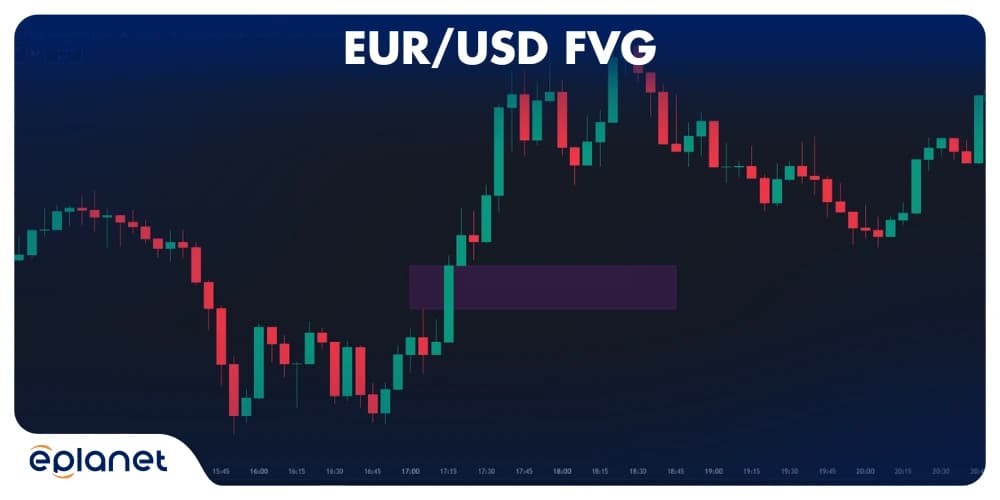
What is a Fair Value Gap? A Fair Value Gap (FVG) is an area of price imbalance represented on a chart as a ‘gap’ between candles, typically created by fast moving markets that never fully test the value of the gap. FVGs are commonly used by traders to determine high probability entry and exit points, as these imbalances later act as areas of support and resistance when the market retraces back to the under priced or overpriced zone. Knowing where the Fair Value Gap exists can provide the trader with a tremendous edge in trading by pointing out any market inefficiencies that need to correct itself.
Key Takeaways
- Fair Value Gaps represent imbalances in the market where price makes a significant move, skipping price levels entirely
- FVGs come in two varieties: bullish (pointing up) and bearish (pointing down), each signaling different trading opportunities
- These gaps tend to act as magnets, with price often returning to "fill" them, creating high-probability trading setups
- FVGs are especially effective when combined with order blocks and other technical analysis tools
- Unlike conventional indicators, FVGs directly reflect actual market psychology and institutional money movements
Introduction
Fair Value Gaps represent one of the most powerful concepts in technical analysis, especially when you understand how they relate to larger market movements. These gaps are essentially "unfinished business" that the market tends to revisit.
Fair Value Gaps are a fundamental element of Smart Money Concept (SMC) and serve as a window into institutional trading behavior. As a key component of smart money analysis, FVGs reveal exactly where big players have moved the market so quickly that price discovery was interrupted. Mastering these smart money-driven gaps gives retail traders a rare glimpse into professional trading patterns and institutional order flow.
What is a Fair Value Gap (FVG)?
A Fair Value Gap (FVG) refers to a price range on a chart where buying and selling activity is unbalanced. This typically arises during a sharp price movement, resulting in a section with minimal or no trading.
Put simply, a fair value gap represents an area the market has skipped over—like a missing puzzle piece. Over time, the market often attempts to revisit and "fill" this gap, bringing the price back to that level.
Fair Value Gap Definition
Technically speaking, a Fair Value Gap is formed when the low of a candle is higher than the high of the next candle (for bearish FVGs) or when the high of a candle is lower than the low of the next candle (for bullish FVGs). It's essentially a gap in the normal flow of price action.
But here's what makes FVGs special: unlike random price movements, these gaps have a tendency to be "filled" as the market naturally seeks equilibrium. This makes them incredibly useful for traders looking for high-probability setups.
Bullish vs. Bearish Fair Value Gaps
Not all gaps are created equal. Understanding the difference between bullish and bearish FVGs is crucial for interpreting what the market might do next.
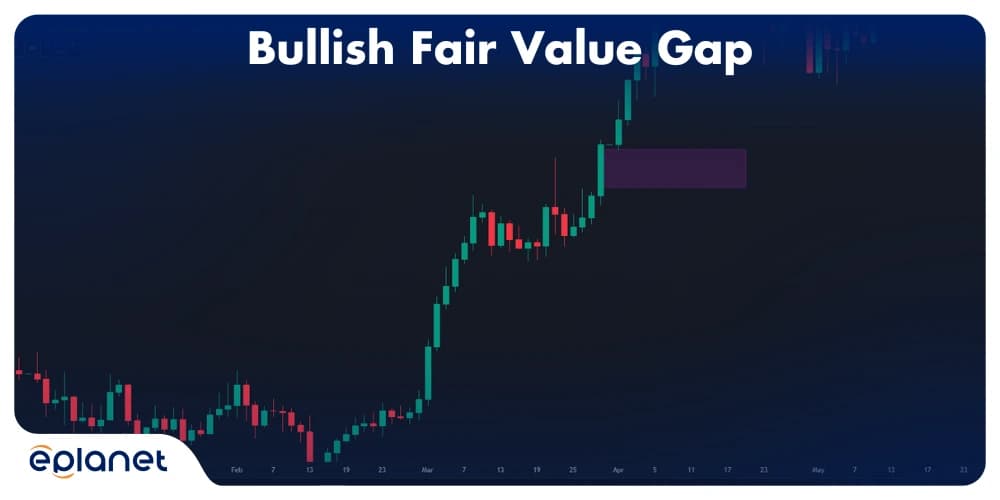
Bullish Fair Value Gap
- Forms when price moves rapidly upward
- Created when buyers suddenly overwhelm sellers
- Appears as an empty space between candles on a chart
- Often signals strong bullish momentum
A bullish FVG forms during an uptrend when the low of one candle is higher than the high of the candle that follows it. This creates an upward-facing gap that suggests buying pressure was so strong that price couldn't follow its normal discovery process.
These bullish gaps often act as support areas if price retraces, making them excellent potential entry points for traders looking to join an uptrend.
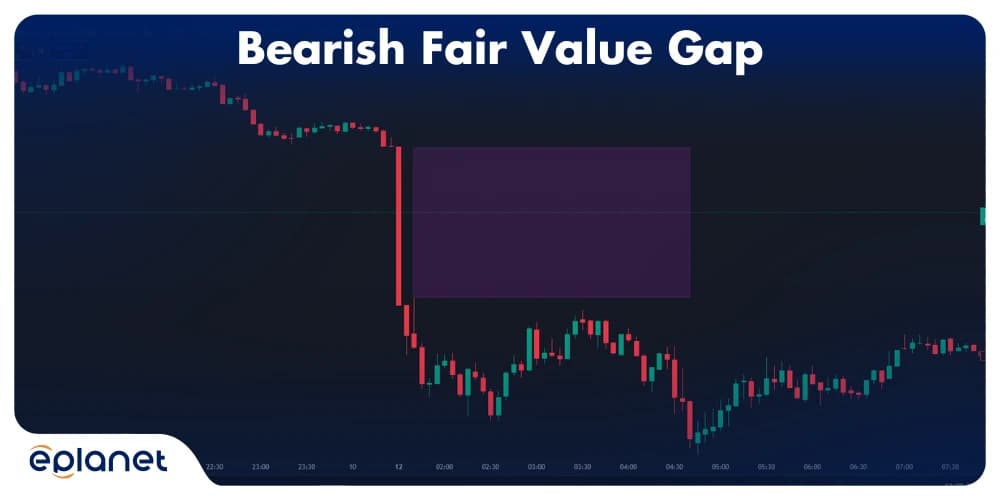
Bearish Fair Value Gap
- Forms when price moves rapidly downward
- Created when sellers suddenly overwhelm buyers
- Also appears as an empty space between candles
- Often signals strong bearish momentum
Conversely, a bearish FVG appears during a downtrend when the high of one candle is lower than the low of the following candle. This downward-facing gap indicates that selling pressure was intense enough to skip price levels entirely.
Bearish FVGs frequently serve as resistance zones if price bounces back up, creating potential shorting opportunities for traders.
Here’s a simple comparison table to help you distinguish between them:
| Characteristic | Bullish FVG | Bearish FVG |
|---|---|---|
| Formation | Low of candle 1 > High of candle 2 | High of candle 1 < Low of candle 2 |
| Direction | Upward | Downward |
| Market Implication | Strong buying pressure | Strong selling pressure |
| Trading Role | Often acts as support | Often acts as resistance |
| Best Used For | Long entries on retracements | Short entries on bounces |
How to Identify Fair Value Gap
Spotting FVGs might seem tricky at first, but once you know what to look for, they practically jump off the chart. Here's my step-by-step process:
- Look for rapid price movements: FVGs typically form during quick, decisive moves in the market
- Check for three consecutive candles: The middle candle is where the action happens
- Compare the highs and lows: For bullish FVGs, check if the low of the first candle is higher than the high of the third candle
- Mark the gap area: The space between these levels represents your FVG
- Confirm with volume: Higher volume during the formation can indicate a stronger FVG signal
What I love about FVGs is that they're not subjective like many other chart patterns. They either exist or they don't—there's no gray area.
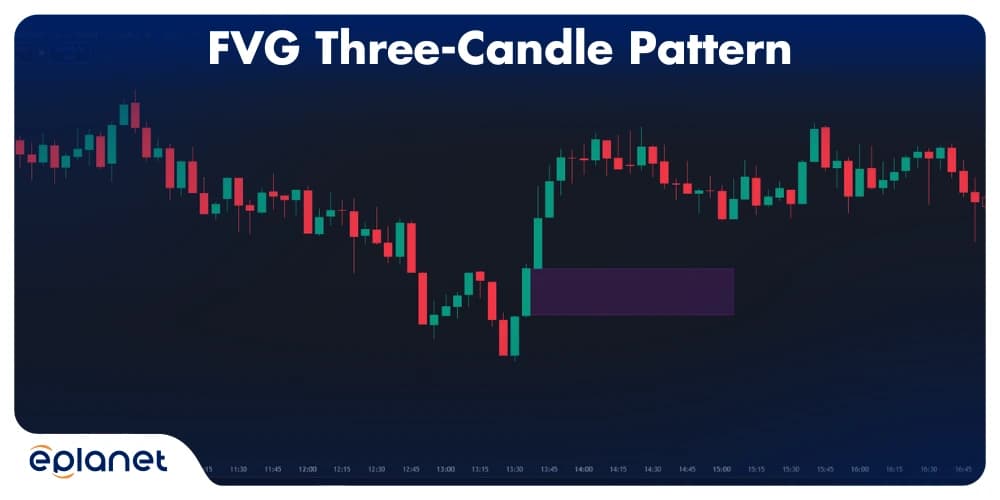
The Three-Candle Pattern
The classic FVG forms with three consecutive candles:
- The Setup Candle: The first candle that establishes the direction
- The Momentum Candle: The second candle that creates the gap by opening beyond the first candle's range
- The Confirmation Candle: The third candle that confirms the gap by not returning to fill it immediately
Let me walk you through how I identify these:
For a Bullish FVG:
- The low of the third candle must be higher than the high of the first candle
- The empty space between them is your Fair Value Gap
For a Bearish FVG:
- The high of the third candle must be lower than the low of the first candle
- The empty space between them is your Fair Value Gap
Here’s a simplified example from one of my recent trading sessions:
| Candle | Open | High | Low | Close | Notes |
|---|---|---|---|---|---|
| 1 (Setup) | 100 | 103 | 99 | 102 | Normal price action |
| 2 (Momentum) | 110 | 115 | 108 | 113 | Sudden jump creating gap |
| 3 (Confirmation) | 112 | 116 | 105 | 108 | Gap confirmed, doesn’t fill immediately |
In this example, the Fair Value Gap exists between 103 (the high of candle 1) and 108 (the low of candle 3).
What Makes a Fair Value Gap Valid?
Not all gaps are created equal. Here's what I look for to validate an FVG before trading it:
Clean Formation
The gap should have a clean, clear structure with minimal price action inside the gap itself. Messy, overlapping candles often indicate choppy market conditions rather than a true Fair Value Gap.
Appropriate Size
Extremely small gaps may not be significant enough to act as strong magnets for price. Conversely, exceptionally large gaps might indicate news-driven moves that may not follow typical filling patterns.
Alignment with Market Structure
The most powerful FVGs align with existing market structure:
- Bullish FVGs that form at support levels
- Bearish FVGs that form at resistance levels
- Gaps that form at previous swing points
Time Consideration
Fresh FVGs (recently formed) tend to be more reliable than older ones. The longer a gap has existed without filling, the less likely it may be to fill in the near future.
How to Trade Fair Value Gaps
Now for the part you've been waiting for—how to actually profit from these market inefficiencies. Trading FVGs effectively requires understanding when they're most likely to be filled and how to structure your trades around them.
The Mitigation Principle
The core concept behind trading FVGs is "mitigation" or "filling" of the gap. Markets have a natural tendency to revisit these skipped price levels, and this tendency creates trading opportunities.
I've found that about 70-80% of FVGs eventually get filled, though the timeframe can vary widely from minutes to months, depending on the market and circumstances.
For more details, check out our article titled How to Identify Mitigation Blocks
Entry Strategies
Here are some proven ways to enter trades using FVGs:
- Retracement Entry: Wait for price to return to the edge of the FVG and enter when it begins to penetrate the gap
- Confirmation Entry: Wait for price to enter the FVG and show signs of continuing through it (like a specific candlestick pattern)
- Aggressive Entry: Place limit orders within the FVG in anticipation of it being filled
- FVG with Order Block: Combine FVGs with order blocks (areas of significant buying or selling) for higher-probability setups
Stop Loss Placement
One advantage of trading FVGs is that they provide clear levels for stop loss placement. Typically, you'd want to place your stop:
- For bullish FVGs: Just below the bottom of the gap
- For bearish FVGs: Just above the top of the gap
Taking Profits
As for profit targets, common approaches include:
- Targeting the complete filling of the gap
- Using previous support/resistance levels beyond the gap
- Employing a risk-reward ratio (like 1:2 or 1:3)
- Trailing stops to capture extended moves
The ICT Trading Strategy with FVGs
The ICT (Inner Circle Trader) methodology places heavy emphasis on Fair Value Gaps as key market structure components. This approach combines FVGs with:
- Order blocks (areas of significant buying or selling)
- Liquidity sweeps (when price moves to trigger stop losses)
- Smart money concepts (tracking institutional money flow)
When these elements align with an FVG, the probability of a successful trade increases dramatically. I've found this especially effective in the forex market.
Read More: What is the ICT Trading Strategy?
What Is Consequent Encroachment and Why It Matters
One common trait that many traders who trade FVGs share is waiting for the price to fill the entire gap. What they don’t understand is that the market can react at any part of the gap.
CE is short for Consequent Encroachment. CE is simply 50% of the Fair Value Gap, established in the same way as the Consequent Rejection (CR) mid point. You establish the top and bottom of the Fair Value Gap and then establish the mid point of that value. The same measurement can be established using a Fibonacci retracement study, and determining the .5 level of the value. CE is a relatively simple measurement at 50% of the total Fair Value Gap.
Why the 50% Level Is a Key Entry Point
In a strong trending market, price frequently retraces only to the midpoint of the FVG before reversing and continuing in the original direction. Traders who wait for the complete gap to fill before entering often miss the move entirely. The gap starts acting as support or resistance from its midpoint, not just at the edges.
This matters for two practical reasons:
- Entry precision: Instead of waiting for a full fill that may never come, you can place a limit order at or near the CE level with a tighter stop loss
- Trade invalidation: If price blows through the CE and closes beyond the far edge of the gap without any reaction, that is a signal the FVG has been invalidated and the original directional bias needs to be reassessed
How to Apply Consequent Encroachment in Your Trading
Here is how I incorporate CE into my FVG setups:
- Identify a valid FVG using the three-candle pattern
- Mark the top and bottom of the gap with horizontal lines
- Add a third line at the exact midpoint. This is your CE level
- Watch for a reaction candle (such as a pin bar or engulfing candle) at or near the CE
- Enter on confirmation at the CE with your stop loss just beyond the far boundary of the gap
- Target the opposing swing high or low at a minimum 1:2 risk-to-reward ratio
Consequent Encroachment vs Full Gap Fill: Which to Use
| Scenario | Use CE Entry | Wait for Full Fill |
|---|---|---|
| Strong trend with momentum | Yes – CE often holds | Risk of missing the move |
| Ranging or choppy market | No – less reliable | Full fill more likely |
| FVG at a key structural level | Yes – high probability | Optional confirmation only |
| FVG formed on news spike | Caution – validate first | Safer to wait for full fill |
A Real Example from XAU/USD
It's something I've noticed quite consistently on a number of trading instruments, particularly Gold. On a 5 minute chart, during an extremely strong run of the price up towards a major level, the market often will have left a previous bullish FVG from an initial displacement move. On the subsequent corrective pullback, price does not always need to move down to the lower end of the gap. Sometimes it'll just drop down to the midpoint of the gap, see a rejection at that point and head back in the opposite direction once again.
I pay close attention to this when analyzing trading opportunities in XAU/USD. Additionally, I try to gauge whether price interaction with the close extension (CE) versus the full gap width boundary provides a clean enough filter to identify potential retracement trade opportunities versus full reversals. Historically, I have found that reactions on an 'equal' failure revista candle to test the CE level to be much more confirmative than the failure revista at the full gap width boundary.
A common misconception about gaps is that they are a sign of a weak stock. However, if a gap does not completely fill out, but instead repays some of the price back to the break point, then it can actually be an even stronger stock. This is because the buyer or seller was aggressive enough to push the stock through the imbalance before the stock could begin to move back in the opposite direction.
Fair Value Gap in Forex Markets
Forex traders, you're in luck! FVGs work exceptionally well in currency markets due to their liquidity and 24-hour nature.
The forex market's continuous trading creates perfect conditions for FVGs to form, especially during transitions between trading sessions or during major news events when price can jump significantly.
Major currency pairs like EUR/USD, GBP/USD, and USD/JPY often display textbook FVG patterns, particularly at the daily and 4-hour timeframes. These higher timeframe FVGs tend to have greater significance and higher probability of being filled.
What makes forex FVGs special is how they often align with key institutional order levels, giving retail traders a glimpse into where the big money might be sitting.
Read More: Definition of forex market and its importance
Fair Value Gap Examples
Let's look at some real-world examples to cement your understanding.
Example 1: Bullish FVG in an Uptrend
Imagine you're watching Bitcoin during a strong uptrend. After a substantial move up, there's a brief consolidation followed by another sharp move higher. Looking closely, you notice that the low of a green candle is significantly higher than the high of the red candle that follows it—creating a perfect bullish FVG.
Two days later, price retraces back to this gap and bounces precisely from the middle of the FVG zone, confirming its role as support and launching another leg up.
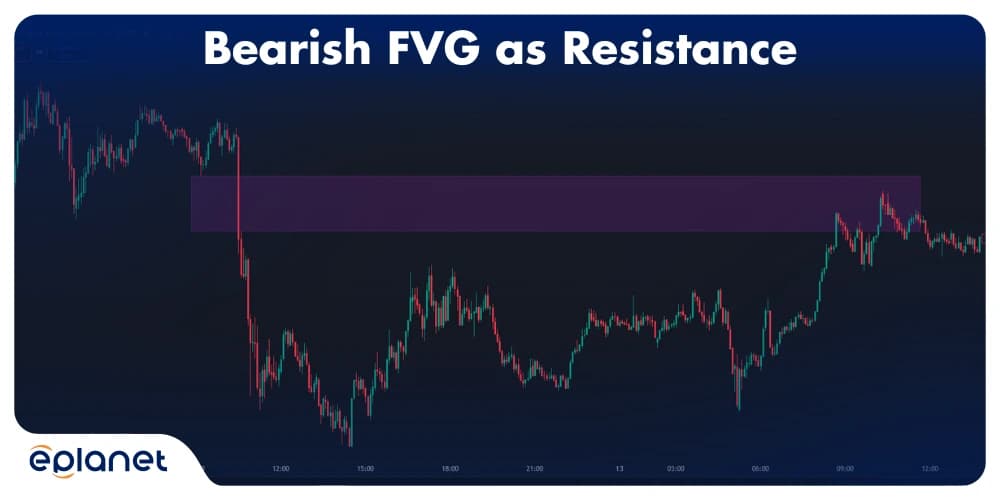
Example 2: Bearish FVG as Resistance
Consider a stock that's been declining. During a particularly aggressive selling phase, you spot a bearish FVG where the high of one candle is well below the low of the next. This gap sits untouched for several weeks.
When the stock eventually stages a recovery, it rallies right up to the lower boundary of this bearish FVG and immediately gets rejected. Traders who recognized this pattern had a perfect opportunity to enter short positions with a clearly defined risk level.
Fair Value Gap and Order Blocks
If you really want to supercharge your FVG trading, combining them with order blocks is where the magic happens.
Order blocks are zones where significant buying or selling took place before a strong move. When an FVG forms near an order block, you've essentially identified an area where institutional orders are likely placed—and that's powerful information.
Here's why this combination works so well:
- Order blocks show where major players entered positions
- FVGs indicate where price is likely to return
- Together, they create a "double confirmation" setup
The best setups often feature an FVG that forms right after an order block, suggesting that institutional buying or selling was strong enough to create market inefficiency.
What Is an Inverse Fair Value Gap (IFVG)?
Once you understand the basic mechanics of the Fair Value Gap, the next big idea to grasp is the Inverse Fair Value Gap (IFVG). One of the more advanced concepts in the ICT framework, the IFVG allows you to reexamine situations where a gap has seemingly failed.
We use the term “Inverse Fair Value Gap” when price moves down through an existing Fair Value Gap. Instead of the gap being rendered useless, it flips. The gap becomes resistance to down movement instead of support for it. Then as price moves up through the gap, the gap flip becomes support for the up movement and resistance to the down movement. We call this phenomenon an FVG flip.
In simplist terms, if the price moves THROUGH THE GAP instead of trading out from the gap, the gap represents the original imbalance which has been refused, and the broken area becomes the area of institutional interest from the opposite side.
Bullish IFVG
A bullish IFVG forms when a bearish Fair Value Gap fails to hold price to the downside. Price pushes up through the bearish gap, closing beyond it. When price later returns to retest that zone from below, it now acts as a demand area rather than resistance. Traders look for confirmation candles at or near the IFVG before entering long positions.
Bearish IFVG
A bearish IFVG forms when a bullish Fair Value Gap fails to support price. Price drops down through the bullish gap, closing beyond it. When price returns to retest that zone from above, it now acts as a supply area. Traders look for rejection candles at the IFVG before entering short positions.
How to Identify a Valid IFVG
Not every gap that gets touched qualifies as an inversion. A wick poking into the gap is not enough. The rules for a valid IFVG are:
- Identify a standard three-candle Fair Value Gap on your chart
- Watch for a candle body close beyond the gap in the opposite direction, not just a wick
- Mark the original gap boundaries. These boundaries now define your IFVG zone
- Wait for price to return and retest the zone from the new direction
- Look for a reaction candle at or near the IFVG before entering
What Makes an IFVG High Probability
IFVGs work best when they appear within a specific context, not in isolation. The setups I pay attention to are the ones that meet at least two of the following conditions:
- The IFVG forms after a liquidity sweep, where price has taken out a swing high or low before reversing
- The zone sits within a higher-timeframe premium or discount area
- There is a Market Structure Shift or Break of Structure occurring around the same time
- The IFVG aligns with a nearby order block or key structural level
IFVG vs Standard FVG: Key Differences
| Standard FVG | Inverse FVG (IFVG) | |
|---|---|---|
| Formation | Three-candle imbalance, gap unfilled | Original FVG broken by a candle close |
| Role | Support or resistance in original direction | Flipped role in opposite direction |
| Signal | Continuation of the original move | Potential reversal or momentum shift |
| Entry trigger | Retracement into the gap | Retest of the broken gap from the new side |
| Invalidation | Price closes through the far boundary | Price closes through the IFVG zone again |
A Practical Note on IFVGs in Gold Trading
On XAU/USD, IFVGs often appear around key weekly levels. The bullish FVG to the ongoing displacement in the chart below got violated as the market swept through the high of the week before reversing and created one of the cleaner short entry zones on the pullback to date. This pattern often gets manifest on the 5-minute chart around the open of the New York session. The initial sweep of the market through a high or low of the week, creates the liquidity to form an IFVG which gets subsequently retested within the same session.
A common, yet egregious error in technical analysis occurs when a Fair Value Gap is retired simply because the price has climbed above the trough of the gap. Instead, the analyst should reclassify, relabel, and mark this phenomenon well, for the structure of its subsequent price action is most compelling in its reverberations when the market returns to the locus of the abandoned gap.
Fair Value Gap vs. Imbalance
These terms are often used interchangeably, but there are subtle distinctions:
Fair Value Gap:
- Specifically refers to the unfilled space between candles
- Has a defined structure with specific candle patterns
- Usually forms during standard market hours
Imbalance:
- A broader concept covering any price inefficiency
- Includes gaps, but also other inefficient price movements
- Commonly used to describe overnight gaps or opening gaps
Think of it this way: all Fair Value Gaps represent imbalances, but not all imbalances qualify as Fair Value Gaps. This distinction helped me refine my trading approach to focus on the most high-probability setups.
Fair Value Gap Indicators
While FVGs can be spotted manually, several indicators have been developed to automate the process. These tools can save you time and help ensure you don't miss potential setups.
Popular FVG Indicators
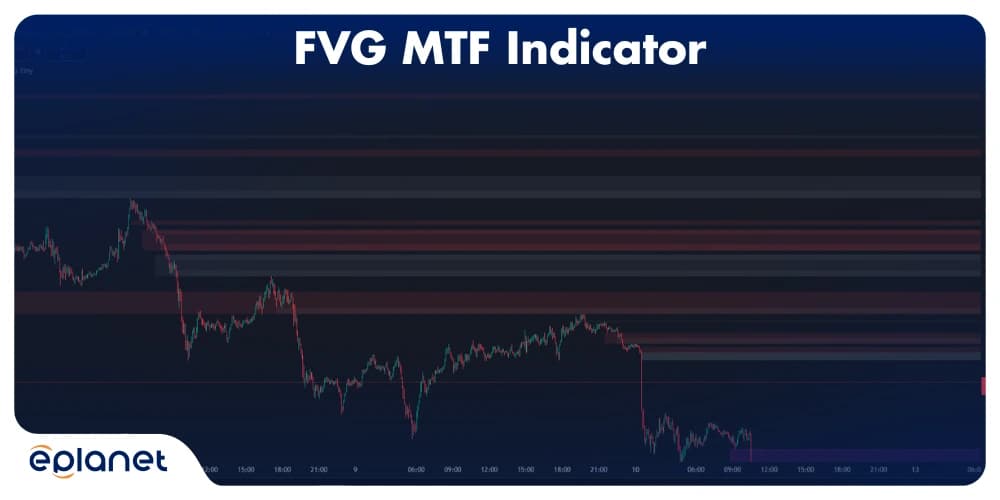
- TrendSpider's FVG Indicator: Automatically identifies and marks FVGs across multiple timeframes
- FVG MTF Indicator: Shows fair value gaps across different timeframes simultaneously
- Smart FVG: Includes filtering options to show only high-probability gaps
What's the best indicator for fair value gaps? Honestly, the one that fits your trading style. Some traders prefer simple indicators that just mark the gaps, while others want comprehensive tools with filtering options and statistical data.
I personally prefer using a basic FVG indicator to identify the gaps and then applying my own analysis to determine which ones are most likely to be filled, rather than relying solely on an algorithm.
Combining EMAs with Fair Value Gaps
One powerful approach I've found particularly effective is combining Exponential Moving Averages (EMAs) with FVGs, especially on 5-minute charts for day trading. Here's why this combination works so well:
The 5-minute timeframe provides enough detail to catch intraday FVGs without the noise of lower timeframes. When you overlay key EMAs—typically the 8, 21, and 50 EMAs—you create a complete trading framework:
- EMA Direction as Trend Filter: The slope and arrangement of these EMAs help confirm whether an FVG is forming in the direction of the dominant trend
- EMA Crossovers Near FVGs: When the 8 EMA crosses the 21 EMA near an FVG, it often signals that the gap is about to be tested
- EMA Support/Resistance Confluence: FVGs that form near key EMA levels (particularly the 50 EMA) have a higher probability of being filled
- 5-Minute Chart Sweet Spot: This timeframe is ideal because institutional algorithms often execute based on 5-minute data, creating cleaner FVGs that align with smart money movements
I've noticed that on 5-minute charts, when price creates an FVG and then the 8 EMA pulls back to the 21 EMA without violating the gap, it creates an extremely high-probability setup. The EMAs essentially act as "guardrails" that help confirm which FVGs are most likely to be respected by the market.
For additional insights, read our article Why Use EMAs on 5-Minute Charts?
DIY Approach
If you prefer not to use indicators, a simple process is:
- Scan charts manually for rapid price movements
- Apply horizontal lines at the boundaries of potential gaps
- Note these levels and watch for price to return to them
This manual approach has the advantage of making you more familiar with how FVGs form and behave, which can improve your intuitive understanding over time.
Creating a Fair Value Gap Trading Plan
After experimenting with countless approaches, I've developed this step-by-step plan for trading FVGs effectively:
Step 1: Scan for FVGs
I begin each session by scanning my watchlist for potential Fair Value Gaps across multiple timeframes, focusing primarily on the 4-hour and daily charts.
Step 2: Qualify the Setups
For each potential FVG, I ask:
- Does it align with the broader trend?
- Is it at a significant support/resistance level?
- Is there confirming evidence (volume, momentum, etc.)?
Step 3: Determine Entry Triggers
I don't enter immediately after identifying an FVG. Instead, I wait for:
- A reversal candle pattern (engulfing, pin bar, etc.)
- A break of a minor trendline
- A retest of a key level
Step 4: Set Precise Targets and Stops
For each trade:
- Primary target: Complete gap fill
- Stop loss: Beyond the most recent swing point
- Risk-reward ratio: Minimum 1:2
Step 5: Monitor and Adjust
Unlike "set and forget" approaches, I actively monitor FVG trades because:
- Some gaps fill partially before reversing
- Market context can change rapidly
- Adjusting stops to breakeven after partial fills improves overall results
This structured approach has significantly improved my consistency with FVG trading.
What is Fair Value Gap in Trading? The Psychological Perspective
Beyond the technical definition, understanding the psychology behind FVGs can give you an edge.
Fair value gaps essentially represent imbalances between buyers and sellers that were so significant that price couldn't move through normal increments. This happens when:
- Large players (institutions) enter or exit positions rapidly
- Unexpected news creates sudden sentiment shifts
- Technical breakouts trigger cascades of orders
These gaps reveal where the market's natural price discovery process broke down, showing us points of exceptional imbalance. And markets, like nature, tend to restore balance over time.
I've noticed that traders who understand this psychological aspect tend to have more patience waiting for gaps to be filled, rather than abandoning their thesis too early.
Common Mistakes When Trading Fair Value Gaps
I've made my share of mistakes with FVGs, and I've seen others make the same ones. Let me save you some painful lessons:
Mistake #1: Assuming All Gaps Must Fill
While the majority of FVGs (around 70-80%) eventually fill, not all do. Some gaps remain unfilled for long periods, especially if they form during significant market regime changes. I've learned to respect when a gap resists filling after multiple attempts—it's telling you something important about market structure.
Mistake #2: Ignoring Market Context
A Fair Value Gap by itself isn't enough reason to enter a trade. You need supporting context:
- What's the overall trend?
- Are you at a key support or resistance level?
- What's the broader market sentiment?
One of my most expensive lessons was taking an FVG trade against a strong trend—that gap never filled, and I paid the price for ignoring the bigger picture.
Mistake #3: Poor Risk Management
Even high-probability setups like FVGs require proper risk management. I always determine:
- My maximum acceptable loss before entering
- The ideal risk-to-reward ratio (I typically aim for at least 1:2)
- Whether the trade aligns with my overall trading plan
Remember, even the best FVG trades can still fail. Never risk more than you can afford to lose on a single setup.
Frequently Asked Questions
What is the difference between a fair value gap and a regular gap?
Regular gaps form between trading sessions (like overnight gaps in stocks) when no trading occurs. Fair value gaps, however, form during active trading when price moves so rapidly that certain levels are skipped. Unlike regular gaps that appear between trading days, FVGs can form at any time during continuous trading.
How reliable are fair value gaps as trading signals?
In my experience, approximately 70-80% of fair value gaps eventually get filled. However, there's no guaranteed timeframe for this to happen—some fill within hours, others may take months. The reliability increases when FVGs align with other technical factors like support/resistance levels, key moving averages, or order blocks.
Do fair value gaps work on all timeframes?
Yes, FVGs can form on any timeframe from 1-minute charts to monthly charts. However, the higher the timeframe, the more significant the gap tends to be. Weekly and daily FVGs generally have a higher probability of being filled and often attract more attention from institutional traders.
Can fair value gaps fail to fill?
Absolutely. No trading method is 100% reliable, and FVGs are no exception. Gaps sometimes fail to be completely filled, especially if market structure dramatically changes or if stronger opposing pressure emerges. This is why proper stop loss placement is crucial when trading based on FVGs.
How can I incorporate fair value gaps into my existing trading strategy?
Start by using FVGs as additional confirmation for your current setups. For example:
- If you're a trend trader, look for FVGs that form in the direction of the trend and use them as potential entry points during retracements
- If you trade support and resistance, pay special attention when these levels align with FVGs
- For breakout traders, FVGs can help identify potential reversal points if the breakout fails
Is FVG an imbalance?
Yes, a Fair Value Gap is a type of imbalance. All FVGs represent imbalances in the market, but not all imbalances are Fair Value Gaps. FVGs have a specific structure defined by the three-candle pattern, while the term "imbalance" can refer to various price inefficiencies, including but not limited to FVGs.
Are fair value gaps liquidity?
Fair Value Gaps themselves aren't liquidity, but they often represent areas where liquidity was absent (which created the gap). Importantly, these areas frequently become magnets for future liquidity as the market attempts to fill the void. Institutional traders sometimes use these gaps as areas to place orders, creating liquidity where it was previously lacking.
What is Consequent Encroachment in Fair Value Gaps?
The Consequent Encroachment (CE) is the 50% midpoint of a Fair Value Gap (FVG). The CE is a high probability area where entries and reactions can occur. In strong trends, the price tends to drop all the way to the CE level before continuing in the direction of the trend. Trading the CE is more profitable than waiting for 100% re-encroachment of the Fair Value Gap.
What is an Inverse Fair Value Gap (IFVG)?
A section of the chart that has been flipped from being a support or resistance area to becoming the opposite is known as an Inverse Fair Value Gap (IFVG). The price moves through a Fair Value Gap (FVG) and then later the entire section is surpassed by the price, creating a ‘reversal’ of sorts. If a bullish FVG was supposed to act as support but gets violated, it becomes a bearish resistance area. Conversely, a bearish FVG that gets violated turns into a bullish support area. IFVGs are most effective after a significant liquidity wipeout and are in sync with the larger Market Structure Shift.
Conclusion
Fair value gaps are pockets of hidden opportunities brought to light by market imperfections and the actions of institutional investors. By learning how to spot fair value gaps and how to trade them, you can gain a profound understanding of market psychology that average retail traders are completely unaware of.
We've seen many FVGs in HNY trade, and most important is to remember that the best FVG trades are those that are fueled by a good mix of technicals and patience. Not every gap will fill on the spot, and even when it does, it is not guaranteed to be a major reversal. But, as with all trading strategies, the secret to success is consistent application, proper risk management, and constant evolution of a methodology.
Please take FVGs into consideration while analyzing charts. Instead of postponing the process, begin to mark them out and allow them to dictate your decisions as you observe price’s behavior. Later, as your analysis matures, you can include FVGs into your trading strategy.