
Horizontal vs Dynamic Support and Resistance: Which One Should You Use?
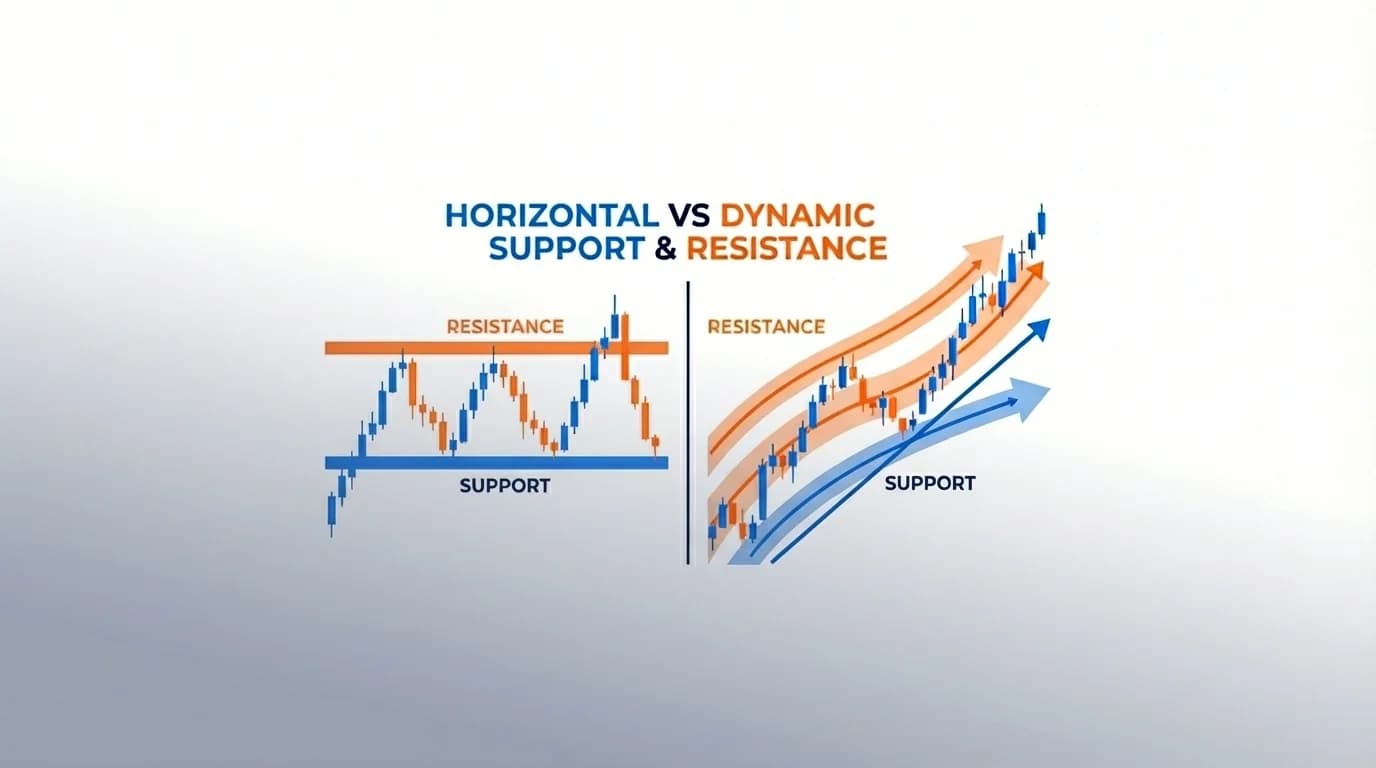
Support and resistance levels form the foundation of technical analysis in forex trading. Horizontal levels remain fixed at specific price points, while dynamic levels adjust with price movement through trend lines and moving averages. Understanding the distinction between these two approaches enables traders to identify potential reversal zones more accurately and optimize entry and exit strategies based on market conditions.
Key Takeaways
- Horizontal support and resistance levels represent static price zones where historical reversals have occurred repeatedly.
- Dynamic support and resistance adapts to changing market trends using moving averages, trend lines, and channels.
- Horizontal levels excel in ranging markets, while dynamic levels perform better in trending conditions.
- Combining both methods provides comprehensive market analysis and reduces false signals.
- The optimal choice depends on current market structure, volatility, and trading timeframe.
Understanding Support and Resistance Fundamentals
Support and resistance represent price levels where buying or selling pressure historically creates reversals or consolidation. These zones function as psychological barriers where market participants make decisions based on previous price action.
Support levels indicate areas where demand exceeds supply, preventing further price decline. Resistance levels mark zones where selling pressure outweighs buying interest, capping upward movement. The strength of these levels increases with the number of times price has tested and respected them.
Horizontal Support and Resistance Explained
Horizontal support and resistance consists of static price levels drawn at specific numerical values. These levels remain constant regardless of time or trend direction. Traders identify horizontal levels by locating previous swing highs, swing lows, round numbers, and historical reversal points.
The primary advantage of horizontal levels lies in their simplicity and objectivity. A support level at 1.2500 in EUR/USD remains 1.2500 whether the market trends upward, downward, or sideways. This fixed nature makes horizontal levels easy to identify and monitor across multiple timeframes.
Horizontal levels demonstrate particular effectiveness in ranging markets where price oscillates between clearly defined boundaries. When markets lack directional bias, these static zones consistently attract buying or selling activity. Major psychological price points, such as round numbers ending in 00 or 50, frequently act as strong horizontal barriers due to clustered orders at these levels.

Characteristics of Horizontal Levels
Horizontal support and resistance exhibits several defining features. These levels derive from actual price history, appearing at points where significant reversals occurred. The level's strength correlates with the number of touches and the volume traded at that price.
Price often approaches horizontal levels multiple times before breaking through. Each successful test reinforces the level's importance in market psychology. When price finally penetrates a strong horizontal level, the breakout typically generates significant momentum.
Role reversal represents another critical characteristic. Former resistance becomes new support after a breakout, and vice versa. This phenomenon occurs because traders who missed the initial breakout place orders at the broken level, anticipating a retest.
Dynamic Support and Resistance Explained
Dynamic support and resistance adjusts continuously as price evolves, creating sloping or curved levels that follow market trends. Moving averages, trend lines, Fibonacci retracement levels, and regression channels constitute common dynamic tools.
Unlike horizontal levels, dynamic support and resistance moves with price direction and momentum. A 50-period moving average slopes upward in an uptrend, providing rising support that adapts to the bullish structure. Similarly, a descending trend line offers dynamic resistance that lowers as a downtrend progresses.
Dynamic levels prove most effective in trending markets where price maintains directional bias. The adaptive nature of these tools allows them to capture the trajectory of price movement rather than relying solely on static historical points. Traders utilizing dynamic support and resistance can maintain positions aligned with prevailing trends while identifying potential reversal areas.

Types of Dynamic Support and Resistance
Moving averages represent the most widely used dynamic tool. The 50-day, 100-day, and 200-day moving averages frequently act as support in uptrends and resistance in downtrends. Price gravitates toward these averages during pullbacks, offering entry opportunities aligned with the dominant trend.
Trend lines connect successive swing lows in uptrends or swing highs in downtrends, creating diagonal support or resistance. The validity of a trend line increases with each successful test. Steeper trend lines indicate aggressive trends but break more easily, while shallow trend lines suggest sustainable price movement.
Bollinger Bands provide dynamic levels based on price volatility. The upper band acts as resistance, while the lower band functions as support. These bands expand during volatile periods and contract during consolidation, adapting to changing market conditions.
Parabolic SAR dots trail price movement, offering dynamic stop-loss levels that accelerate as trends strengthen. This tool helps traders protect profits while allowing trends to develop fully.
What Is the Difference Between Static and Dynamic Support?
Static support remains at a fixed price level regardless of market conditions or time passage. Dynamic support moves continuously with price action, adjusting its position based on trend direction and momentum.
Static support originates from historical price points where reversals occurred, such as previous lows or psychological levels. Once identified, a static support level at 1.3000 stays at 1.3000 permanently. Dynamic support, conversely, shifts constantly as moving averages recalculate or trend lines extend.
The application context differs significantly. Static support works optimally when markets range or when identifying key levels for long-term analysis. Dynamic support excels when markets trend, providing adaptive levels that respect the directional flow of price.
Reaction speed presents another distinction. Static levels offer clear, predetermined points for decision-making. Dynamic levels require continuous monitoring and adjustment as the market evolves, demanding more active management from traders.
Which One Is Better, Static or Dynamic?
Neither static nor dynamic support and resistance holds inherent superiority. The optimal choice depends on market conditions, trading style, and timeframe. Each method offers distinct advantages in specific contexts.
Static levels provide clarity in ranging markets where price oscillates within defined boundaries. Horizontal support and resistance requires less monitoring and offers objective reference points that all market participants observe. Major psychological levels and historical extremes create strong static zones that persist for extended periods.
Dynamic levels deliver superior performance in trending markets. Moving averages and trend lines capture directional momentum that static levels cannot reflect. Dynamic tools adapt to changing volatility and price structure, maintaining relevance as markets evolve. Traders following trends benefit from the adaptive nature of dynamic support and resistance.
Professional traders typically employ both methods simultaneously. Horizontal levels identify major zones of interest, while dynamic tools provide tactical entry and exit points within the broader structure. This combination reduces false signals and improves risk-reward ratios by confirming setups with multiple forms of analysis.

Practical Applications and Strategy Integration
Effective trading strategies incorporate both horizontal and dynamic support and resistance to maximize probability and minimize risk. The integration process begins with identifying major horizontal levels on higher timeframes, establishing key zones where significant reversals may occur.
Within these horizontal boundaries, traders apply dynamic tools to lower timeframes for precise timing. A trader might identify horizontal support at 1.2500 on the daily chart, then use a 20-period moving average on the 4-hour chart to time entries as price pulls back to dynamic support above the major horizontal level.
Confluence zones where horizontal and dynamic levels intersect offer the highest probability setups. When price approaches a major horizontal support level that also aligns with a rising 200-day moving average, the combined support increases the likelihood of a bounce. Multiple forms of support or resistance at the same price area create stronger barriers.
Timeframe Considerations
Higher timeframes favor horizontal levels for identifying major support and resistance zones. Daily and weekly charts reveal significant historical levels that persist for months or years. These static zones guide overall positioning and risk management decisions.
Lower timeframes benefit from dynamic tools that capture short-term momentum and trend direction. Moving averages on 15-minute or hourly charts provide adaptive levels for intraday trading. The faster timeframe allows dynamic levels to respond quickly to price changes without the lag inherent in higher timeframe static analysis.
Multi-timeframe analysis combines both approaches. Traders identify horizontal levels on daily charts for overall context, then use dynamic levels on 4-hour charts for entry timing. This hierarchical structure ensures alignment with major support and resistance while optimizing execution.
Comparison Table: Horizontal vs Dynamic Support and Resistance
| Feature | Horizontal Support/Resistance | Dynamic Support/Resistance |
|---|---|---|
| Position | Fixed at specific price levels | Adjusts continuously with price movement |
| Identification | Historical swing points, round numbers | Moving averages, trend lines, channels |
| Optimal Conditions | Ranging markets, consolidation | Trending markets, directional movement |
| Stability | Remains constant over time | Changes with each new price bar |
| Ease of Use | Simple to identify and monitor | Requires continuous recalculation |
| Breakout Clarity | Clear penetration signals | Gradual shifts, less definitive breaks |
| Psychological Impact | Strong due to visible clusters | Moderate, based on technical following |
| Best Timeframe | Higher timeframes (daily, weekly) | Lower to medium timeframes (1H to 4H) |
| Risk Management | Fixed stop-loss levels | Trailing stops that adapt to trends |
| Complementary Use | Defines major zones | Provides tactical entry/exit points |
Advanced Techniques for Combining Methods
Sophisticated traders layer horizontal and dynamic levels to create comprehensive support and resistance frameworks. This approach begins with marking all significant horizontal levels from multiple timeframes, establishing a hierarchy of price zones based on historical importance.
Dynamic tools then overlay this structure. Moving averages of various lengths provide multiple dynamic levels that interact with horizontal zones. When a 50-day moving average approaches major horizontal support, the confluence creates a high-probability reversal area worth monitoring closely.
Trend channel analysis combines both concepts. The channel boundaries form dynamic support and resistance that slope with the trend, while horizontal levels within the channel offer internal reference points. Price often bounces between the channel edges while respecting horizontal zones during pullbacks.
Breakout and Retest Strategies
Horizontal level breakouts generate trading opportunities when confirmed by dynamic indicators. A breakout above horizontal resistance gains validity when price closes above the level and a moving average crosses through simultaneously. The double confirmation reduces false breakout risk.
Retests of broken horizontal levels offer low-risk entries when dynamic support aligns. After breaking horizontal resistance, price often returns to test the level as new support. If a rising moving average also provides dynamic support near the horizontal level, the setup combines multiple supportive factors.
Dynamic trend line breaks signal potential reversals in directional markets. When price penetrates a long-standing trend line while approaching major horizontal support, the combination suggests trend exhaustion. This confluence allows traders to anticipate reversals before they fully develop.
Risk Management Applications
Support and resistance levels, whether horizontal or dynamic, serve essential risk management functions. Stop-loss placement below support or above resistance limits downside while allowing positions room to develop. The type of level chosen affects stop positioning.
Horizontal levels offer precise stop-loss placement. A trader buying at 1.2520 can place a stop just below horizontal support at 1.2480, creating a clear 40-pip risk parameter. This fixed positioning simplifies risk calculation and position sizing.
Dynamic levels enable trailing stops that lock in profits as trends progress. A trader might trail a stop below a rising 20-day moving average in an uptrend, tightening the stop as price advances. This approach protects gains while allowing the trend to continue without premature exit.
Read More: Forex Risk Management Strategies

Position Sizing Considerations
The distance between entry and support/resistance determines position size. Wider stops required for dynamic levels in volatile markets necessitate smaller position sizes to maintain consistent risk percentages. Horizontal levels in ranging markets often allow tighter stops and consequently larger positions.
Risk-reward ratios improve when combining both methods. Entry near dynamic support with the next major horizontal resistance as a target creates favorable risk-reward scenarios. The dynamic level provides a close stop, while the distant horizontal level offers substantial profit potential.
Common Mistakes and How to Avoid Them
Traders frequently misapply support and resistance concepts, leading to preventable losses. Over-reliance on a single method represents the most common error. Using only horizontal levels in trending markets results in repeated stop-outs as price consistently breaks static levels while respecting dynamic trend lines.
Conversely, relying exclusively on dynamic levels in ranging markets generates numerous false signals. Moving averages whipsaw during consolidation, providing unreliable support and resistance. Horizontal levels offer clearer boundaries in these conditions.
Drawing excessive levels clutters charts and creates analysis paralysis. Every minor swing does not constitute significant support or resistance. Focus on major levels tested multiple times with substantial price reactions. Quality exceeds quantity in level identification.
Ignoring timeframe context undermines effectiveness. A strong support level on a 15-minute chart may hold little significance on a daily chart. Always consider the relationship between trading timeframe and analysis timeframe. Higher timeframe levels generally override lower timeframe signals.
Must Read: How to Draw Support and Resistance Correctly in Forex Trading
Validation and Confirmation
Premature entries before price reaches identified levels reduce win rates. Anticipating support or resistance often results in entering too early, exposing positions to further adverse movement. Wait for price to actually reach the level and show reaction before committing capital.
Failing to confirm breakouts leads to false breakout traps. A single candle close beyond a level does not necessarily constitute a valid breakout. Require confirmation through increased volume, momentum indicator agreement, or multiple closes beyond the level.
Neglecting volume analysis at support and resistance reduces accuracy. Strong levels typically show volume surges when tested, indicating active participation. Low volume at supposed major levels suggests weak support or resistance likely to break easily.
Frequently Asked Questions
What is the difference between static and dynamic support?
Static support maintains a fixed price level based on historical data, remaining constant regardless of current market action. Dynamic support adjusts continuously with price movement through tools like moving averages and trend lines that recalculate with each new price bar.
Which one is better, static or dynamic?
Neither proves universally superior. Static support and resistance excel in ranging markets and for identifying major psychological levels. Dynamic support and resistance outperform in trending conditions where adaptive levels better capture directional momentum. Optimal results emerge from combining both methods based on current market structure.
Conclusion
Horizontal and dynamic support and resistance represent complementary analytical approaches rather than competing methodologies. Horizontal levels provide stable reference points derived from historical price action, offering clear zones where reversals repeatedly occur. Dynamic levels adapt to evolving market conditions, capturing trend direction and momentum through adjustable tools.
Effective trading demands understanding when each method applies most appropriately. Ranging markets favor horizontal analysis, while trending markets reward dynamic tools. The highest probability setups emerge at confluence zones where both types align, creating reinforced support or resistance areas.
Traders who master both approaches gain comprehensive market perspective. Start by identifying major horizontal levels on higher timeframes to establish key zones. Then apply dynamic tools on lower timeframes for tactical timing. This hierarchical approach combines the stability of static analysis with the adaptability of dynamic tools.
Continuous refinement through observation and backtesting develops proficiency in recognizing which levels matter most in various market conditions. The discipline to wait for clear setups at validated support and resistance levels distinguishes profitable traders from those who struggle with premature entries and poor risk management.