
Master Support and Resistance Trading: Your Complete Technical Analysis Guide
Master Support and Resistance Trading: Your Complete Technical Analysis Guide
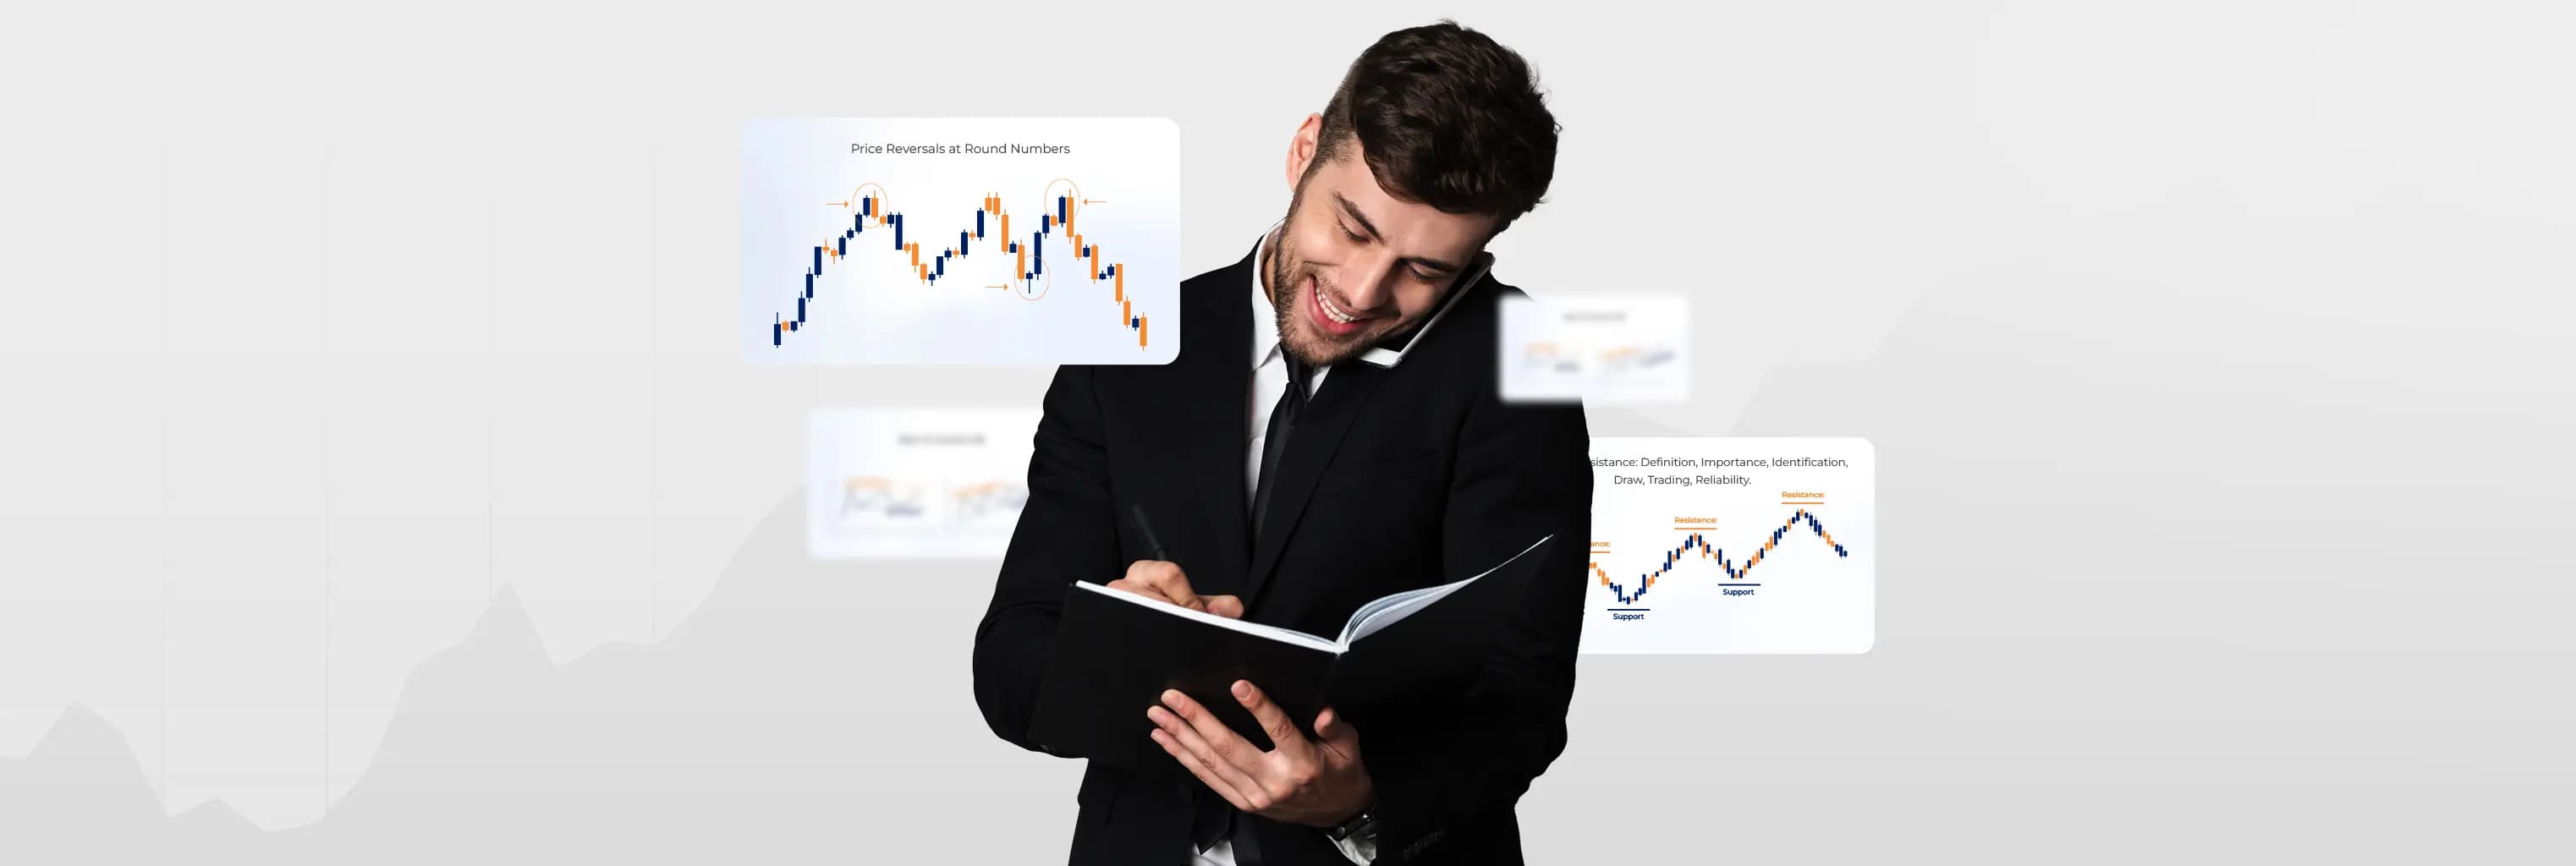
Support and resistance are like the floor and ceiling of price movements—invisible boundaries where currency pairs tend to pause, reverse, or break through. As a forex trader, understanding these critical levels can transform your analysis from guesswork into strategic decision-making. Think of support as the safety net that catches falling prices, while resistance acts as the glass ceiling preventing upward momentum. These aren't just lines on a chart; they're psychological battlegrounds where buyers and sellers clash.
Key Takeaways
- Support levels mark price zones where buying pressure historically overcomes selling pressure, creating a floor that prevents further declines
- Resistance levels represent ceiling prices where selling pressure typically outweighs buying interest, often causing reversals or consolidation
- The more times a level is tested without breaking, the stronger it becomes, making these zones increasingly reliable for trading decisions
- When support or resistance breaks, it often flips roles—former support becomes new resistance and vice versa, a phenomenon traders call role reversal
- Volume confirmation strengthens the validity of these levels, as high trading activity at support or resistance indicates genuine market interest
What Does Support and Resistance Actually Mean?
Let me break this down in a way that'll stick with you. Imagine you're at an auction. Support is that stubborn bidder who keeps showing up at a specific price point, refusing to let the item sell for less. Resistance? That's the seller who won't budge above a certain number, no matter how many people are waving their paddles.
In forex trading, support represents a price level where demand is strong enough to prevent the price from declining further. It's where buyers see value and start opening long positions aggressively. You'll notice that every time the price approaches this level, it bounces back up like a basketball hitting concrete.
Resistance works the opposite way. It's a price ceiling where selling pressure intensifies, preventing further upward movement. Think of it as a psychological barrier where traders who bought earlier start taking profits, or where new sellers enter because they believe the price has climbed too high.
These concepts form the cornerstone of technical analysis—the practice of forecasting price movements by studying historical chart patterns and market data. While fundamental analysis looks at economic reports and central bank policies, technical analysis focuses on what the charts themselves reveal. Support and resistance are arguably the most fundamental building blocks of this entire discipline, showing up in every trading strategy from day trading to long-term position trading.

The fascinating thing about these levels is they're not magic numbers pulled from thin air. They're born from collective human psychology, historical price action, and the memory of market participants. When EUR/USD repeatedly bounced from 1.1000 in the past, traders remember that level. Next time the price approaches 1.1000, they anticipate the same behavior—and their collective actions often make it a self-fulfilling prophecy.
The Theory Behind Support and Resistance
Here's where things get interesting. The theory of support and resistance isn't just technical mumbo-jumbo; it's rooted in basic economics and human behavior. Supply and demand create these levels, but psychology cements them.
When a currency pair falls to a certain level and bounces multiple times, it creates a memory in the market. Traders start setting their buy orders around that zone. Institutions program their algorithms to recognize these levels. Even your grandmother, if she were trading (and she probably shouldn't be), would notice the pattern.
The role reversal principle is particularly clever. Once a support level breaks—say USD/JPY crashes through 110.00—that former safety net becomes a new barrier. Why? Because traders who bought at 110.00 are now underwater. If the price climbs back to 110.00, they'll likely sell to break even, creating resistance. It's like a revolving door of market psychology.
The Psychology Behind Support and Resistance
You know what's wild? These levels exist primarily because traders believe they exist. It's a massive, coordinated dance where millions of participants move in sync based on shared beliefs about where prices should stop or reverse.
Fear and greed drive this psychology. At support levels, greed kicks in—traders see a bargain and pile in. At resistance, fear takes over—"This is as high as it goes, better sell now!" The emotions are so predictable that you can almost chart them alongside the price movements.
Professional traders understand this psychological component and use it ruthlessly. They know retail traders will place stop losses just below support or above resistance. So what do the big players do? They push the price just far enough to trigger those stops, collect the liquidity, then reverse the market back in the original direction. It's called a stop hunt, and it happens more than you'd think.
How to Identify Key Levels in Trading
Finding support and resistance isn't about drawing random lines and hoping for the best. There's an art and science to it, and I'm going to show you both.
Historical Pivot Points
Start by zooming out on your chart. Look for price levels where the market repeatedly reversed direction. These historical pivots are gold mines because they represent collective market memory. If GBP/USD bounced from 1.2500 three times last year, you better believe traders are watching that level like hawks.
Round Numbers and Psychological Levels
Here's a secret that seems too simple to work, but it does: round numbers matter. Humans love round numbers. We set our alarms for 7:00, not 6:57. We celebrate turning 30, 40, 50. In forex, traders gravitate toward levels like 1.2000, 1.2500, 1.3000. These psychological levels often act as magnets for support and resistance.

Volume and Price Consolidation Zones
When price consolidates in a tight range with heavy volume, pay attention. These zones indicate areas where lots of trading occurred, meaning lots of traders have positions at those prices. These become future battlegrounds for support and resistance.
Trendlines and Channels
Don't forget diagonal support and resistance. Draw trendlines connecting higher lows (uptrend support) or lower highs (downtrend resistance). These dynamic levels adapt as the market evolves, providing continuous reference points for your trading decisions.
The 3-5-7 Rule in Trading: Your Secret Weapon
Let me introduce you to something that changed my trading game—the 3-5-7 rule. This isn't as widely discussed as it should be, but it's brilliant in its simplicity.
The rule suggests that support and resistance levels become increasingly significant when tested 3, 5, or 7 times. Why these specific numbers? It's about pattern recognition and market memory.
Three tests establish a level as legitimate. The first touch could be random, the second interesting, but the third confirms a pattern. Traders start paying attention.
Five tests make a level strong. By now, everyone sees it. Algorithms have it marked. It becomes a focal point for trading decisions. Breaking through a five-time tested level usually triggers significant momentum.
Seven tests create a legendary level. These are rare but powerful. Think of them as fortress walls that have repelled multiple assaults. When these finally break, the move that follows is often explosive because so much pent-up energy releases at once.
I've seen EUR/USD test 1.1000 seven times over several months before finally breaking through. When it did, the move was swift and decisive—exactly what the 3-5-7 rule predicts.
Number of TestsLevel StrengthBreak PotentialTypical Move After Break1-2WeakHighModerate3-4ModerateMediumSignificant5-6StrongLowVery Significant7+Extremely StrongVery LowExplosive
The 90% Rule and 5-3-1 Rule in Forex
Here's where we get into some insider knowledge that separates consistent traders from the perpetually confused.
What is the 90% rule in forex?
The 90% rule states that approximately 90% of traders lose money, largely because they trade against support and resistance rather than with it. More specifically, when price breaks through a significant level, about 90% of the prior trading range can get retraced before the breakout continues. This creates opportunities for savvy traders who understand the rhythm.
When you see a breakout from resistance, don't chase it immediately like an excited puppy. Wait for the pullback. More often than not, the price will retrace to test the broken level (now acting as support) before continuing higher. That pullback is your entry point—you're buying at the discounted price with confirmation that the level has flipped roles.
What is the 5-3-1 rule in forex?
The 5-3-1 rule is a risk management framework that pairs beautifully with support and resistance trading:
- 5 currency pairs maximum to watch and trade
- 3 strategies or setups you master completely
- 1 time frame to focus your analysis on
Why does this matter for support and resistance? Because when you're tracking 20 pairs across multiple time frames with a dozen different strategies, you'll miss the cleanest setups. Focus creates clarity. I watch five pairs, I trade three setups (all involving support and resistance), and I make my decisions based on the 4-hour chart. Simple, effective, profitable.
Is Support Bullish or Bearish?
This question trips up beginners constantly, so let's clear it up. Support itself is neither bullish nor bearish—it's a reference point. However, how price interacts with support tells you everything about sentiment.
When price bounces from support, that's bullish. It means buyers stepped in aggressively, overwhelming sellers. It signals that the downward pressure has exhausted itself, at least temporarily. This is where you look for long opportunities.
When price breaks below support, that's decidedly bearish. The floor has crumbled. Buyers gave up or got overwhelmed. Former support becomes new resistance, and the path of least resistance (see what I did there?) is now downward.
Here's the nuanced part: a support level being tested multiple times can actually become bearish. Why? Because each test weakens it slightly. It's like a dam being pounded by water—eventually, it cracks. If you see support tested four or five times in quick succession, be prepared for a break rather than another bounce.
Do you buy or sell at resistance?
At resistance, the default play is to look for selling opportunities, but context matters enormously. If you're in a strong uptrend and price touches resistance, you might wait for a break and retest before buying. If you're in a downtrend, resistance offers an excellent risk-reward for short positions. Never trade resistance in isolation—consider the broader trend, volume, and momentum indicators.
Practical Trading Strategies with Support and Resistance
Enough theory. Let's talk about making money. Here are battle-tested strategies I've used for years.
The Bounce Trade
This is bread-and-butter support and resistance trading. Wait for price to approach a well-established support level. Watch for signs of reversal—bullish candlestick patterns, RSI divergence, increasing volume on the bounce. Enter long with your stop loss just below support. Target the midpoint between support and resistance, or the resistance level itself.
The beauty of this strategy? Your risk is clearly defined. If support breaks, you're out with a small loss. If it holds, you're in for a potentially significant move with a favorable risk-reward ratio.
The Breakout Play
This is for the more aggressive traders. When price breaks through resistance with conviction (strong candlestick close, high volume), that's your signal. But here's the trick—don't chase the breakout immediately. Wait for the pullback to the broken level, now acting as new support. Enter long on the retest with stops below the new support level.
Why wait for the pullback? Because breakouts fail about 50% of the time. The retest confirms the breakout's validity and gives you a much better entry price. It's the difference between buying at 1.2050 after a breakout from 1.2000, versus buying at 1.2010 on the retest. That 40 pips matters.
How to profit from support and resistance?
The most consistent way to profit is through the "R-multiple" approach. At support, place your entry at the bounce, stop loss below support, and target at resistance. If support is at 1.2000, your stop at 1.1980 (20 pips), and resistance at 1.2060 (60 pips), you've got a 3R trade. Win rate doesn't have to be exceptional when your winners are three times your losers. Focus on high R-multiple setups at key levels.
Range Trading
When a market is clearly ranging between defined support and resistance, you've got a gift-wrapped trading opportunity. Buy at support, sell at resistance, repeat until the range breaks. Use indicators like RSI to confirm overbought/oversold conditions at these levels.
The key is recognizing when the range is over. If you're long from support and resistance breaks upward, don't stubbornly take profits at the old resistance. Let the trade run. Ranges don't last forever, and the breakout moves often dwarf the range-bound gains.

Which Indicator is Best for Support and Resistance?
I get asked this constantly, and the answer might surprise you: none of them. The best indicator is price action itself. Those candlesticks tell you everything you need to know if you learn to read them properly.
That said, certain tools can enhance your support and resistance analysis:
Fibonacci Retracements: These are fantastic for identifying potential support and resistance levels within trends. The 38.2%, 50%, and 61.8% retracement levels often coincide with strong support or resistance zones.
What is the Fibonacci indicator?
Fibonacci retracements use ratios derived from the Fibonacci sequence (0.236, 0.382, 0.500, 0.618, 0.786) to identify potential reversal levels. After a significant move, traders draw Fibonacci levels from the swing high to swing low (or vice versa). These mathematical levels often align with psychological support and resistance points, creating powerful confluence zones for trading decisions.
Moving Averages: The 50-period and 200-period moving averages often act as dynamic support and resistance. When price is above the 200-day MA, it tends to find support there during pullbacks. Below it, the MA becomes resistance.
Pivot Points: These are calculated levels based on the previous period's high, low, and close. They're widely watched by institutional traders, which gives them self-fulfilling power. The daily pivot point and its associated support and resistance levels can provide excellent intraday reference points.
What indicators confirm support?
Volume is the ultimate confirmation indicator. When price bounces from support with a surge in volume, it confirms strong buying interest. Additionally, RSI showing oversold readings (<30) at support, MACD showing bullish divergence, or a hammer candlestick pattern all strengthen the case for a valid support level. The more confluence, the better.
What is the best indicator for support and resistance?
If I had to choose one, I'd pick volume. It validates everything. A support level touched with minimal volume might be weak. The same level touched with heavy volume that produces a reversal? That's high-probability gold. Volume is the voice of the market—it tells you when the big players are involved and when support or resistance truly matters.

How to Practice and Master Support and Resistance
Mastery doesn't come from reading articles (though this one's pretty damn good). It comes from screen time and deliberate practice. Here's how to accelerate your learning curve.
Historical Chart Analysis
Open your trading platform and scroll back in time. Pick any currency pair and mark all significant support and resistance levels. Now scroll forward slowly, watching how price interacts with those levels. Did they hold? Did they break? When they broke, did they flip roles? This exercise builds pattern recognition faster than anything else.
Do this for an hour a day for a month, and you'll start seeing levels that other traders miss. You'll develop an instinct for where support and resistance should be, even before the price gets there.
Demo Trading with Focus
I know demo trading gets a bad rap, but it's perfect for practicing specific skills. Trade only setups involving support and resistance. Journal every trade: where was the level, what was your entry trigger, what happened. Review your journal weekly. You'll spot patterns in your decision-making, both good and bad.
How to confirm support and resistance breakout?
Confirm breakouts using the "3 C's": Candlestick close beyond the level (preferably a strong-bodied candle), Confirmation from increased volume, and Continuation through at least one additional period without immediate reversal. False breakouts typically fail quickly—if price breaks resistance but closes back below it within 1-2 periods, stay out or reverse your position.
Multiple Time Frame Practice
Support and resistance on a 15-minute chart might be noise on the daily chart. Practice identifying levels across different time frames—daily, 4-hour, hourly. Notice how major time frame levels trump minor ones. This develops the critical skill of prioritizing which levels actually matter for your trading decisions.
How Reliable Are Support and Resistance Levels?
Let's be honest: nothing in trading is 100% reliable. Support and resistance included. But they're about as close as you'll get to high-probability setups.
The reliability depends on several factors:
Strength of the level: A support level tested seven times over three months is far more reliable than one that appeared last Tuesday.
Time frame: Daily and weekly levels are more reliable than 5-minute levels. The bigger the time frame, the more significant the level.
Market context: Support works better in ranging markets, while breakouts work better in trending markets. Using support/resistance strategies in the wrong market condition is a recipe for losses.
Volume confirmation: As I've mentioned repeatedly, volume validates levels. Low-volume touches are less reliable than high-volume interactions.
Studies suggest that well-identified support and resistance levels have approximately a 60-70% success rate. That might not sound spectacular, but remember—in trading, you don't need a 90% win rate. You need edges that you can exploit consistently with proper risk management.
What happens if support is broken?
When support breaks decisively, expect accelerated downside movement. This occurs because: stop losses clustered below support get triggered (creating selling pressure), traders who were long from higher prices panic sell, and short sellers who were waiting for confirmation enter aggressively. The former support typically becomes new resistance. The first retest of broken support often fails, sending price lower again.
Common Mistakes to Avoid
Even experienced traders screw up support and resistance trading. Here are the pitfalls I see repeatedly:
Drawing too many lines: Your chart shouldn't look like a spider web. The key to drawing support and resistance correctly is focusing on the most obvious, well-tested levels. If you need a magnifying glass to find the level, it's probably not significant.
Ignoring the time frame: That support on the 5-minute chart means nothing if the daily chart shows strong resistance right above it. Always consider the bigger picture.
Trading at support without confirmation: Just because price touches support doesn't mean it'll bounce. Wait for reversal signals—a bullish candlestick pattern, momentum shift, or volume spike. Catching falling knives leads to bleeding accounts.
Forgetting about role reversal: When support breaks, it's not support anymore. Adjust your thinking immediately. Stubbornly holding long positions because "it's at support" after support has broken is financial suicide.
Using exact numbers: Support isn't a line, it's a zone. Think of it as a neighborhood rather than an address. Price might find support anywhere between 1.1980 and 1.2010 if that's the general area of historical significance.
Advanced Concepts: Taking Your Trading to the Next Level
Once you've mastered the basics, here are some advanced concepts to explore:
Confluence Zones
Magic happens when multiple factors align. A level that's both a Fibonacci retracement and a previous swing low and a round number? That's a confluence zone, and it's exponentially more powerful than any single factor. These are the cream of the crop for high-probability trades.
Time-Based Support and Resistance
Not all support and resistance is price-based. Sometimes markets reverse at specific times. Trading sessions open and close, market openings, major news releases—these temporal factors create their own patterns of support and resistance. The London open (3 AM EST) frequently marks intraday highs or lows for EUR pairs.
Which time frame is useful for positional trading?
For position trading with support and resistance, focus on daily and weekly charts. These time frames filter out noise and show the levels that truly matter to long-term market participants. Weekly support levels can hold for months, providing excellent positioning opportunities for swing and position traders. Consider using monthly charts for identifying major structural levels in very long-term analysis.
Dynamic Support and Resistance
Not everything is horizontal. Trendlines, moving averages, and Bollinger Bands create dynamic support and resistance that moves with the market. Learning to trade bounces off a rising trendline (dynamic support in an uptrend) adds another dimension to your trading arsenal.
Learn More: Horizontal vs Dynamic Support and Resistance

Real-World Application: Putting It All Together
Theory without application is useless, so let's walk through a real trading scenario.
Imagine EUR/USD has been trending upward for weeks. It pulls back to 1.0950, a level that acted as resistance three times in the previous month. You're watching this level carefully because of the potential role reversal. Price touches 1.0950, forms a bullish engulfing candlestick, and volume spikes on the green candle.
Your analysis: Former resistance should now be support. The bullish engulfing shows strong buying pressure. Volume confirms institutional interest. The broader trend remains up. This is a textbook long opportunity.
You enter long at 1.0955. Stop loss at 1.0930 (25 pips below the support zone). Target the previous resistance at 1.1020 (70 pips away). Risk-reward: almost 3:1. Time frame: 4-hour chart.
Price initially dips to 1.0945, testing your conviction. You hold because it hasn't broken your stop. Then it reverses, climbing steadily. Within 18 hours, it hits your target. You're out with a 70-pip win against a 25-pip risk.
This isn't hypothetical—this exact scenario plays out regularly in forex markets. Understanding these patterns gives you the edge you need to capitalize on them consistently.
Integrating Support and Resistance with Other Technical Analysis Tools
Support and resistance don't exist in a vacuum. The most successful traders combine these levels with other technical analysis methods to create powerful, high-conviction trading systems.
Combining with Chart Patterns
When you spot a head and shoulders pattern forming at a major resistance level, you've found gold. Similarly, a double bottom at strong support creates exceptional entry opportunities. Learn to recognize how candlestick patterns interact with support and resistance to amplify your edge.
Triangle patterns, flags, and pennants all rely on support and resistance as their structural foundation. The breakout from these patterns becomes more significant when it occurs at a historically important level.
Using Trend Analysis
Support and resistance work differently in trending versus ranging markets. Understanding trend analysis and identification helps you determine whether to trade the bounce or the break. In strong uptrends, focus on support bounces. In downtrends, resistance rejections offer better odds.
Trendlines themselves are dynamic support and resistance. Mastering how to draw and trade trendlines enhances your ability to catch moves early in their development.
Volume Analysis Integration
We've touched on volume, but dedicated volume analysis techniques deserve deeper study. Volume profile, accumulation/distribution, and on-balance volume provide context that transforms good support and resistance levels into great ones.
When institutional volume confirms a support level, you're trading with the smart money rather than against it.
Technical Indicators as Confirmation
While price action reigns supreme, strategic use of technical indicators adds layers of confirmation:
- Moving averages create dynamic support and resistance
- RSI divergence at key levels signals potential reversals
- MACD crossovers near support or resistance confirm momentum shifts
- Bollinger Bands squeeze at support often precedes breakouts
Learn which indicators complement your support and resistance strategy rather than cluttering your charts with everything available.
Final Thoughts: Your Path Forward
Support and resistance form the foundation of technical analysis. They're the skeleton key that unlocks understanding of price behavior across all markets and time frames. But knowing about them and profiting from them are vastly different things.
Start simple. Identify the obvious levels. Watch how price behaves at those levels. Keep a journal. Practice with focus. Gradually add layers of sophistication—volume analysis, confluence zones, multiple time frames. But always return to the basics when you're confused.
Remember, trading isn't about being right 100% of the time. It's about recognizing high-probability setups, managing risk intelligently, and letting mathematics work in your favor over dozens or hundreds of trades. Support and resistance give you those high-probability setups. Your discipline and risk management determine whether you profit from them.
The markets will be here tomorrow, next month, next year. Take your time. Master the fundamentals. Practice until reading support and resistance becomes second nature. And when you're ready, apply these principles with real money—starting small, trading smart, and building your account steadily.
Your journey to consistent profitability starts with understanding where price is likely to pause, reverse, or explode. You've got the knowledge now. Time to put in the work.