Technical Analysis: Your Complete Guide to Reading Market Charts
Technical analysis is your window into understanding price movements without getting lost in company balance sheets or economic reports. If you've ever wondered how traders predict where currency prices are headed next, this is it—reading charts, spotting patterns, and using indicators to make informed decisions. Whether you're new to forex trading or looking to sharpen your skills, understanding technical analysis can transform how you approach the market and potentially boost your trading success.


What Is Technical Analysis?
Picture this: you're standing in front of a weather map, looking at patterns that help you predict if tomorrow will bring sunshine or rain. Technical analysis works similarly, except instead of weather patterns, you're reading price charts to forecast where forex markets might move next.
At its core, technical analysis is the practice of studying past market data—primarily price and volume—to identify patterns and trends that can hint at future price movements. Unlike fundamental analysis, which digs into economic indicators and news events, technical analysis keeps its eyes glued to the charts. It's all about what the market is doing rather than why it's doing it.
Think of it as the market's diary. Every price movement tells a story, and technical analysts are the detectives piecing together these clues. The beauty? You don't need a PhD in economics. You just need to understand patterns, trends, and a handful of tools that generations of traders have relied on.
Key Takeaways
- Technical analysis focuses on price action and chart patterns rather than economic fundamentals, making it accessible for traders who prefer visual data over financial statements.
- The method relies on three core assumptions: markets discount everything, prices move in trends, and history tends to repeat itself through recognizable patterns.
- Key tools include chart patterns, technical indicators, and support/resistance levels that help identify potential entry and exit points in forex trading.
- It works best when combined with proper risk management and an understanding that no prediction method is foolproof—probabilities matter more than certainties.
The Four Pillars of Technical Analysis
Every solid structure needs a strong foundation, and technical analysis stands on four unshakeable pillars. Let me walk you through each one.
1. Price Discounts Everything
This is the big one. Technical analysts believe that all available information—economic data, political events, market sentiment, even rumors—is already reflected in the price. If the Federal Reserve hints at a rate hike, the dollar's price chart will show the market's reaction before the official announcement even hits the major news networks.
You don't need to read every economic report or track every news bulletin. The chart does that work for you. It's like having thousands of traders around the world vote with their money, and their collective decision shows up as price movements on your screen.
2. Prices Move in Trends
Here's something I've noticed watching forex markets: prices rarely move in straight lines or complete chaos. They trend. They move in recognizable directions for periods of time—upward, downward, or sideways.
The trend is your friend, as traders love to say. Once you identify a trend, you can ride it like a wave. An uptrend shows higher highs and higher lows. A downtrend does the opposite. And when the market can't decide? You get a sideways trend, also called consolidation.
Understanding trends helps you align your trades with the market's momentum rather than fighting against it. Swimming upstream might build character, but it rarely builds your trading account.
3. History Repeats Itself
Human psychology doesn't change much. Fear, greed, hope, panic—these emotions have driven markets for centuries, and they create repeating patterns on charts. That head and shoulders pattern you spot today? Traders were seeing the same thing in the 1920s.
These patterns form because traders react similarly to similar situations. When prices approach a previous high, many traders remember what happened last time and make comparable decisions. This collective memory creates patterns you can recognize and use.
4. The Market Has Memory
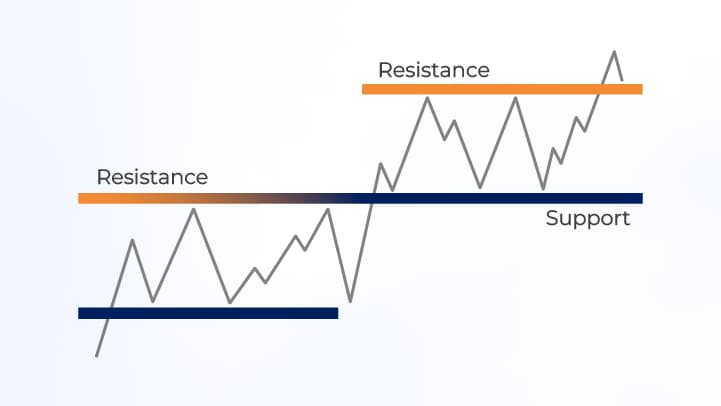
Support and resistance levels are like the market's bookmarks. Support is where prices tend to stop falling because buyers step in. Resistance is where prices struggle to climb higher because sellers take control.
These levels often form at psychologically significant price points—round numbers, previous highs and lows, or areas where major moves started. Once these levels are established, they tend to matter repeatedly, even months or years later.
What Are the Two Types of Technical Analysis?
Technical analysis isn't one-size-fits-all. It splits into two main approaches, and most successful traders use both.
Classical Technical Analysis
This is the original flavor—the method that's been around since the Japanese were trading rice futures in the 1700s (yes, really!). Classical technical analysis focuses on chart patterns you can see with your naked eye: triangles, flags, head and shoulders, double tops and bottoms.
These patterns form naturally as supply and demand create recognizable shapes on price charts. A double bottom, for example, shows price testing a support level twice before bouncing higher—suggesting buyers are ready to push prices up.
Classical analysis also includes drawing trend lines, identifying support and resistance, and recognizing candlestick patterns. It's visual, intuitive, and doesn't require any complex calculations.
Quantitative Technical Analysis
Enter the modern era. Quantitative technical analysis uses mathematical formulas and statistical indicators to analyze price data. We're talking about Moving Averages, Relative Strength Index (RSI), MACD, Bollinger Bands, and dozens of other indicators.
These tools process price data through algorithms and spit out signals. An RSI reading above 70 might suggest a currency pair is overbought. A MACD crossover could signal a potential trend change.
The advantage? These indicators can spot things the human eye might miss and remove some emotional bias from trading decisions. The downside? They can contradict each other and require practice to interpret correctly.
Most traders blend both approaches. They use classical patterns to understand the bigger picture and quantitative indicators to fine-tune their timing.
The Four Basics of Technical Analysis You Need to Master
Ready to get practical? Here are the fundamental building blocks every forex trader should understand.
1. Understanding Chart Types
Your chart is your trading canvas, and it comes in different styles:
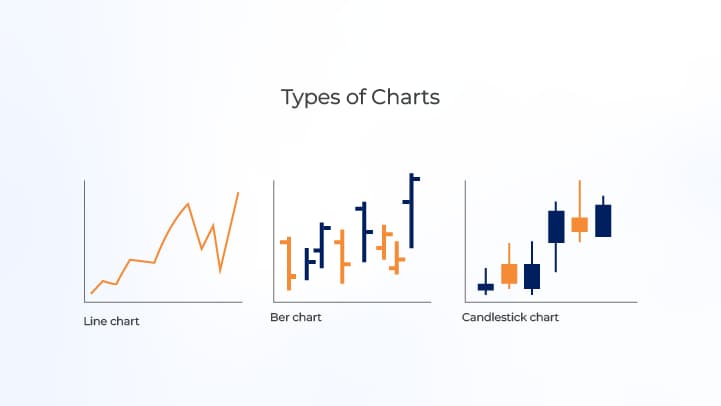
Line Charts: The simplest form, connecting closing prices with a continuous line. Great for seeing the overall trend but lacking in detail.
Bar Charts: Show opening, high, low, and closing prices for each period. More information than line charts but can look cluttered to beginners.
Candlestick Charts: The favorite among most traders. Each "candle" shows open, high, low, and close prices, with color coding (typically green/red or white/black) indicating whether price rose or fell. They're visual, information-rich, and reveal price action psychology.
I recommend starting with candlestick charts. They're industry-standard and pack the most information into an easy-to-read format.
Read More: Chart Types: Essential Visual Tools for Forex Trading Analysis
2. Identifying Trends
Before you place any trade, ask yourself: what's the trend? Use these simple rules:
- Uptrend: Price makes higher highs and higher lows
- Downtrend: Price makes lower highs and lower lows
- Sideways: Price bounces between horizontal support and resistance
Draw trend lines connecting these highs and lows. When price respects these lines, your trend is intact. When it breaks through convincingly, the trend might be changing.
3. Support and Resistance
These are your trading landmarks. Support is where buying pressure exceeds selling pressure, preventing prices from falling further. Resistance is the opposite—where sellers overpower buyers.
Here's a trader secret: when support breaks, it often becomes new resistance. And when resistance breaks, it often becomes new support. These role reversals happen because traders remember these levels and adjust their behavior accordingly.
Read More: Master Support and Resistance Trading: Your Complete Technical Analysis Guide
4. Volume Analysis
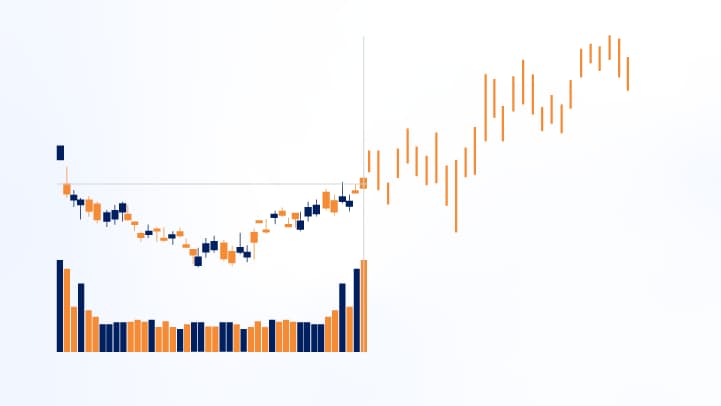
Volume tells you how many trades are happening. High volume confirms price movements—it means traders are committed to the move. Low volume suggests weak conviction and potential reversals.
When price breaks through resistance on high volume, that's a strong signal. When it breaks on low volume, be skeptical. The market might lack the conviction to sustain the move.
Read More: Volume Analysis: The Hidden Secret Behind Smart Forex Trading
What Is the 50% Rule in Trading?
Here's a fascinating principle that many traders swear by: the 50% retracement rule. It states that after a significant price move, the market often retraces approximately 50% of that move before continuing in the original direction.
Let's say EUR/USD rallies from 1.0500 to 1.0700—that's a 200-pip move. The 50% rule suggests price might pull back to around 1.0600 (the halfway point) before potentially resuming its upward journey.
Why does this happen? It's part psychology, part profit-taking. After a strong move, some traders lock in profits, causing a temporary reversal. Others see this pullback as a second chance to enter the trade. When these forces balance around the 50% mark, you often get a bounce.
The 50% level isn't magic, though. It's more guideline than law. Sometimes retracements stop at 38.2% or 61.8% (hello, Fibonacci levels!), and sometimes they don't retrace at all. But knowing this principle helps you set realistic expectations and spot potential entry points.
Pro tip: combine the 50% rule with other technical signals like support levels or indicator readings. A 50% retracement that aligns with a previous support zone? That's a setup worth watching.
Technical Analysis Patterns That Actually Matter
Walk into any trading floor (virtually, these days), and you'll hear traders talking about patterns. Some work consistently, others are overhyped. Let me share the patterns that have stood the test of time.
Reversal Patterns
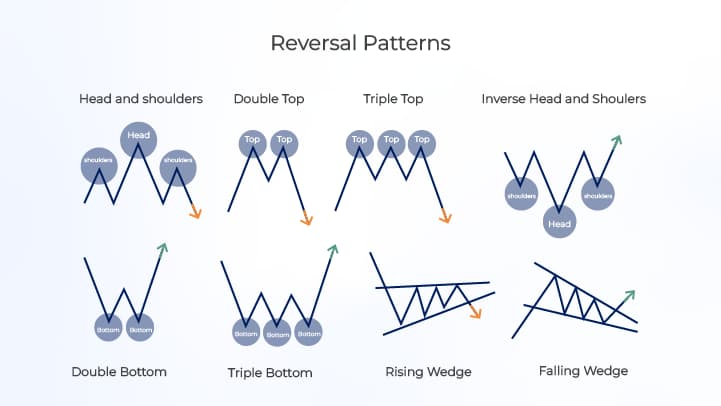
Head and Shoulders: This one looks exactly like it sounds—a left shoulder, a head (higher peak), and a right shoulder. When you spot this at the top of an uptrend, it often signals a reversal to the downside. The inverse (upside-down version) signals potential upward reversals.
Double Tops and Bottoms: Price tries twice to break through a level and fails both times, suggesting the trend is exhausted. A double top looks like the letter 'M' and signals bearish reversals. Double bottoms look like 'W' and signal bullish reversals.
Triangles: These come in several flavors—ascending, descending, and symmetrical. They show a battle between buyers and sellers with narrowing price ranges. Eventually, price breaks out in one direction, often with force.
Read More: Technical Analysis Reversal Patterns
Continuation Patterns
Flags and Pennants: These are brief consolidations in strong trends that look like small rectangles (flags) or small triangles (pennants). They're like the market taking a quick breath before continuing its run.
Rectangles: Price bounces between horizontal support and resistance, consolidating before breaking out in the direction of the previous trend.
Candlestick Patterns
Doji: A candle where open and close prices are nearly identical, showing indecision. After a strong trend, it might signal a reversal.
Engulfing Patterns: One candle completely engulfs the previous one. A bullish engulfing pattern (green candle swallowing a red one) can signal upward reversals. Bearish engulfing works oppositely.
Hammer and Shooting Star: Hammers have small bodies with long lower shadows, showing rejection of lower prices—bullish. Shooting stars have long upper shadows, showing rejection of higher prices—bearish.
Remember, patterns alone don't guarantee outcomes. They show probabilities. Confirm them with other technical tools and always manage your risk.
Technical Analysis Indicators: Your Trading Toolkit
Indicators are mathematical calculations based on price and volume that help you spot trends, momentum, and potential reversals. Here are the ones that forex traders actually use.
Trend-Following Indicators
Moving Averages (MA): These smooth out price data by calculating the average price over a specific period. The 50-day and 200-day MAs are popular for identifying longer-term trends. When price is above the MA, the trend is likely bullish. Below it? Probably bearish.
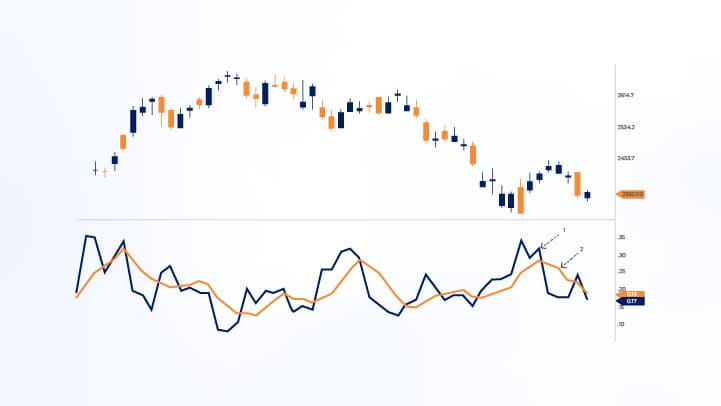
Moving Average Convergence Divergence (MACD): This indicator shows the relationship between two moving averages. When the MACD line crosses above the signal line, it's bullish. Cross below? Bearish. It also shows momentum and potential reversals through divergences.
Momentum Indicators
Relative Strength Index (RSI): This oscillator measures the speed and change of price movements on a scale of 0 to 100. Above 70 suggests overbought conditions (possible pullback coming). Below 30 suggests oversold conditions (possible bounce coming).
Stochastic Oscillator: Similar to RSI but compares a specific closing price to a range of prices over time. It helps identify overbought and oversold conditions with values above 80 and below 20 respectively.
Volatility Indicators
Bollinger Bands: These bands sit above and below a moving average by a certain number of standard deviations. They expand during volatile periods and contract during quiet periods. Price touching the upper band might signal overbought conditions; touching the lower band might signal oversold.
Average True Range (ATR): Measures market volatility by calculating the average range between highs and lows. It doesn't predict direction but helps you understand how much movement to expect and set appropriate stop losses.
Volume Indicators
On-Balance Volume (OBV): Adds volume on up days and subtracts it on down days, creating a running total. Rising OBV confirms uptrends; falling OBV confirms downtrends.
Here's my take: don't overload your charts with indicators. Pick 2-3 that complement each other—perhaps a trend indicator, a momentum indicator, and a volume indicator. More isn't better; clarity is.
Fundamental Analysis vs Technical Analysis: The Age-Old Debate
Walk into any trading forum and you'll find this debate raging. Some traders swear by fundamentals; others trust only charts. Let me break down both sides.
Fundamental Analysis: The Big Picture
Fundamental analysis examines economic factors, interest rates, GDP growth, employment data, and political events to determine a currency's "true value." If you follow Reserve Bank of India announcements or US Federal Reserve decisions, you're thinking fundamentally.
Strengths:
- Helps you understand the underlying economic forces driving currency values
- Useful for long-term position trading
- Can spot major trends before they show up on charts
Weaknesses:
- Requires extensive research and economic knowledge
- Timing trades based on fundamentals alone is difficult
- Markets can stay "irrational" longer than you expect
Read More: Key Economic Indicators on the Forex Factory Calendar
Technical Analysis: The Chart Reader
Technical analysis ignores the "why" and focuses purely on price action, patterns, and indicators. It assumes everything you need to know is already in the price.
Strengths:
- Works across different timeframes—minutes to months
- Provides specific entry and exit signals
- Doesn't require tracking endless economic reports
- Works in markets driven by sentiment and speculation
Weaknesses:
- Can produce false signals
- Doesn't account for surprise news events
- Requires practice to interpret correctly
The Smart Approach: Blend Both
Here's what successful traders often do: use fundamental analysis to understand the bigger trend and technical analysis to time specific trades. If fundamentals suggest the US dollar should strengthen, use technical analysis to find the best entry point.
Think of fundamentals as telling you which direction to drive and technical analysis as showing you when to turn the wheel. You wouldn't navigate with only a compass or only a map—you need both.
AspectFundamental AnalysisTechnical AnalysisFocusEconomic data, news, eventsPrice charts, patterns, indicatorsTime HorizonLong-termAny timeframeEntry/Exit TimingDifficultSpecific signalsRequired KnowledgeEconomics, financeChart reading, patternsBest ForDirection biasPrecise execution
Creating Your Technical Analysis Strategy
Theory is great, but let's get practical. How do you actually use technical analysis to make trading decisions?
Step 1: Start With the Bigger Picture
Open a daily or weekly chart. What's the major trend? Is EUR/USD in a long-term uptrend, downtrend, or range? This bigger picture keeps you aligned with dominant market forces.
Step 2: Zoom In to Find Entries
Once you know the trend, zoom to a 4-hour or 1-hour chart to find specific entry points. Look for patterns or indicator signals that align with the bigger trend. If the daily chart shows an uptrend, you're hunting for bullish setups on shorter timeframes.
Step 3: Confirm With Multiple Signals
Never trade on one signal alone. If you spot a bullish candlestick pattern, check if it's at a support level. Does RSI confirm oversold conditions? Is volume increasing? Multiple confirmations reduce false signals.
Step 4: Set Your Levels
Before entering any trade, determine:
- Entry point: Where exactly will you buy or sell?
- Stop loss: Where will you exit if the trade goes against you?
- Take profit: Where will you lock in profits?
Use technical levels like support/resistance or recent highs/lows to set these points. Never enter a trade without knowing your exit strategy.
Step 5: Manage Your Risk
This is crucial. Risk only 1-2% of your trading capital on any single trade. It doesn't matter how perfect your setup looks—markets are unpredictable, and risk management keeps you in the game long enough to succeed.
Step 6: Review and Learn
Keep a trading journal. Record your setups, why you took them, and what happened. Over time, you'll notice which patterns and indicators work best for your style.
Common Technical Analysis Mistakes (And How to Avoid Them)
Let me save you some pain by sharing mistakes I've seen countless traders make.
Overcomplicating Your Charts
New traders often slap every indicator they can find onto their charts. The result? A rainbow mess that's impossible to interpret. Keep it simple. 2-3 indicators maximum. If you can't explain your setup in one sentence, it's too complicated.
Ignoring the Trend
Fighting the trend is like trying to swim upstream in a river. Possible? Yes. Smart? Rarely. The trend reflects dominant market forces. Trading against it requires exceptional timing and often ends badly.
Seeing Patterns That Aren't There
Our brains love finding patterns, even in random data. Just because you can draw a triangle on your chart doesn't mean it's meaningful. Patterns need to be clear, well-formed, and confirmed by price action.
Neglecting Risk Management
You can have perfect technical analysis and still blow up your account with poor risk management. Set stop losses. Risk appropriate amounts. Don't revenge trade after losses. Your survival as a trader depends more on risk management than pattern recognition.
Trading Every Signal
Not every signal deserves a trade. Sometimes the best trade is no trade. Wait for high-probability setups that align multiple factors in your favor. Quality over quantity wins in trading.
Ignoring Fundamental Events
Technical analysis isn't performed in a vacuum. If a central bank rate decision is dropping in 30 minutes, that's probably not the best time to trust your technical setup. Major news can override technical signals instantly.
Why Technical Analysis Works Across All Markets
Here's something beautiful about technical analysis: it's truly universal. Whether you're trading in Asia, Europe, or the Americas, the principles remain the same.
Time Zone Flexibility: Forex markets operate 24 hours during weekdays, moving from Asian to European to American sessions. Technical analysis helps you navigate each session's unique characteristics. Asian sessions might be quieter, European sessions more volatile—your charts adapt to show you what's happening regardless of your location.
Works With Any Currency Pair: Whether you're trading major pairs like EUR/USD, exotic pairs, or your local currency against the dollar, technical patterns and indicators function identically. A double bottom on USD/JPY signals the same thing as a double bottom on GBP/AUD.
Accessibility for All Traders: Not everyone has time to analyze endless economic reports or track global news 24/7. Technical analysis offers a more accessible approach for part-time traders balancing regular jobs, students learning the markets, or anyone who prefers visual data over fundamental research.
Regulatory Compliance: Regardless of where you live, understanding technical analysis helps you trade permitted instruments effectively within your local regulatory framework. The charts don't care about borders—they show price action, period.
The beauty is this: a head and shoulders pattern works the same whether you're trading in Mumbai, London, New York, or Sydney. Price action speaks a universal language, and technical analysis is your translator.
Resources to Deepen Your Technical Analysis Knowledge
Ready to level up? Here are practical ways to build your skills:
Books Worth Reading
- "Technical Analysis of the Financial Markets" by John Murphy—the comprehensive bible
- "Japanese Candlestick Charting Techniques" by Steve Nison—master the candlesticks
- "Technical Analysis Explained" by Martin Pring—great for understanding indicators
Practice Without Risk
Open a demo trading account and practice applying technical analysis with virtual money. Test different indicators, practice drawing trend lines, spot patterns. Most brokers offer free demo accounts that mirror real market conditions.
Study Real Charts
Spend time looking at charts daily. Review past price action and identify patterns and indicators that would have predicted moves. This "backtesting" builds pattern recognition faster than any book.
Join Trading Communities
Connect with other traders through forums and social media groups focused on technical analysis. Seeing how others analyze markets expands your perspective and exposes you to new techniques.
Keep Learning
Markets evolve, and so should your technical analysis skills. Stay curious. Try new indicators. Test different timeframes. The best traders never stop learning.
Frequently Asked Questions
What is meant by technical analysis?
Technical analysis is a method of evaluating and predicting future price movements by studying past market data, primarily price and volume. Instead of analyzing economic fundamentals, it focuses on chart patterns, trends, and statistical indicators to identify trading opportunities. Essentially, it's reading the market's "price history" to forecast where it might go next.
What are the 4 pillars of technical analysis?
The four pillars are: (1) Price discounts everything—all information is already reflected in the price; (2) Prices move in trends—markets follow identifiable upward, downward, or sideways movements; (3) History repeats itself—human psychology creates recurring patterns; and (4) The market has memory—support and resistance levels matter repeatedly. These foundational principles underpin all technical analysis strategies.
What is the 50% rule in trading?
The 50% rule suggests that after a significant price movement, the market often retraces approximately 50% of that move before continuing in the original direction. It happens due to profit-taking and new entries. Traders use this principle to identify potential entry points during pullbacks, though it's more guideline than absolute rule and works best when combined with other technical signals.
What are the two types of technical analysis?
The two main types are classical technical analysis and quantitative technical analysis. Classical focuses on visual chart patterns like triangles, head and shoulders, and candlestick formations. Quantitative uses mathematical indicators like Moving Averages, RSI, and MACD. Most successful traders combine both approaches—using classical patterns for the bigger picture and quantitative indicators for precise timing.
What are the four basics of technical analysis?
The four fundamentals every trader should master are: (1) Understanding different chart types (line, bar, candlestick); (2) Identifying trends (uptrend, downtrend, sideways); (3) Recognizing support and resistance levels where price tends to reverse; and (4) Analyzing volume to confirm price movements. These basics form the foundation for more advanced technical strategies.
Conclusion: Your Path Forward With Technical Analysis
So here we are. You've journeyed through the world of charts, patterns, and indicators. You understand the four pillars, know the difference between classical and quantitative approaches, and can spot patterns and use indicators that matter.
But here's the thing: reading this article is just the beginning. Technical analysis isn't something you learn once and master forever. It's a skill you develop through consistent practice, honest self-assessment, and continuous learning.
The markets will humble you. You'll spot perfect-looking setups that fail. You'll miss obvious signals and kick yourself later. You'll second-guess your analysis a thousand times. That's normal. Every successful trader has been there.
What separates those who succeed from those who don't isn't perfect pattern recognition or magical indicators. It's discipline. Risk management. Emotional control. The willingness to learn from mistakes and adapt your approach.
Start small. Practice on demo accounts. Master one or two patterns before adding more to your arsenal. Learn a few indicators deeply rather than dabbling in dozens. Build your foundation brick by brick, and before you know it, you'll be reading charts with confidence and making decisions based on solid technical analysis.
The forex market isn't going anywhere. It'll be here tomorrow, next month, next year. There's no rush. Focus on becoming consistently profitable rather than getting rich quick.
Ready to start your technical analysis journey? Open your charts, practice what you've learned here, and remember—every expert trader was once a beginner who refused to give up. Your future in forex trading starts with the next chart you analyze.
Now go make it happen.
