Mastering Forex Trends: The Ultimate Guide for Traders
Trends are the heartbeat of forex trading—they tell you where the market's been and hint at where it's headed next. Whether you're watching currency pairs climb, crash, or crawl sideways, understanding trends gives you the edge to trade smarter, not harder. Think of trends as the current in a river; swim with it, and you'll glide effortlessly toward profit. Fight against it? Well, that's when things get messy.

Introduction: Why Trends Matter More Than You Think
Picture this: you're standing on a beach, watching waves roll in. Some crash hard and fast, others barely make it to shore, and some just kinda... meander. That's basically the forex market in a nutshell. And here's the thing—trend analysis is your best friend when it comes to reading those waves.
I've seen countless traders jump into the market without understanding trends, hoping they'll magically pick the right moment to buy or sell. Spoiler alert: magic doesn't work in trading. What does work is recognizing patterns, identifying momentum, and riding the wave when it's in your favor.
The beauty of trends? They're everywhere. Currency pairs don't move randomly—they follow patterns that you can spot, analyze, and profit from. Whether you're a day trader catching quick moves or a swing trader playing the long game, understanding trends separates the pros from the amateurs.
Key Takeaways
- Trends reveal market direction – Identify whether currency pairs are moving up, down, or sideways to align your trades with momentum
- Three trend types dominate forex – Uptrends show strength, downtrends signal weakness, and sideways markets mean indecision
- Trendlines guide entry and exit points – Drawing accurate trendlines helps you spot support, resistance, and potential reversals
- Indicators confirm trend strength – Tools like moving averages and RSI validate what your eyes are telling you about price action
- Trend trading beats prediction every time – Focus on following established trends rather than trying to predict the next big move
What is a Trend?
Let's strip away the fancy terminology for a second. A trend is simply the general direction that a currency pair moves over time. That's it. No mystery, no complexity—just direction.
But here's where it gets interesting. Trends aren't straight lines. They zigzag, they pause, they fake you out. You'll see prices climb for weeks, then suddenly drop for a few days before resuming their upward march. That's normal. That's how markets breathe.
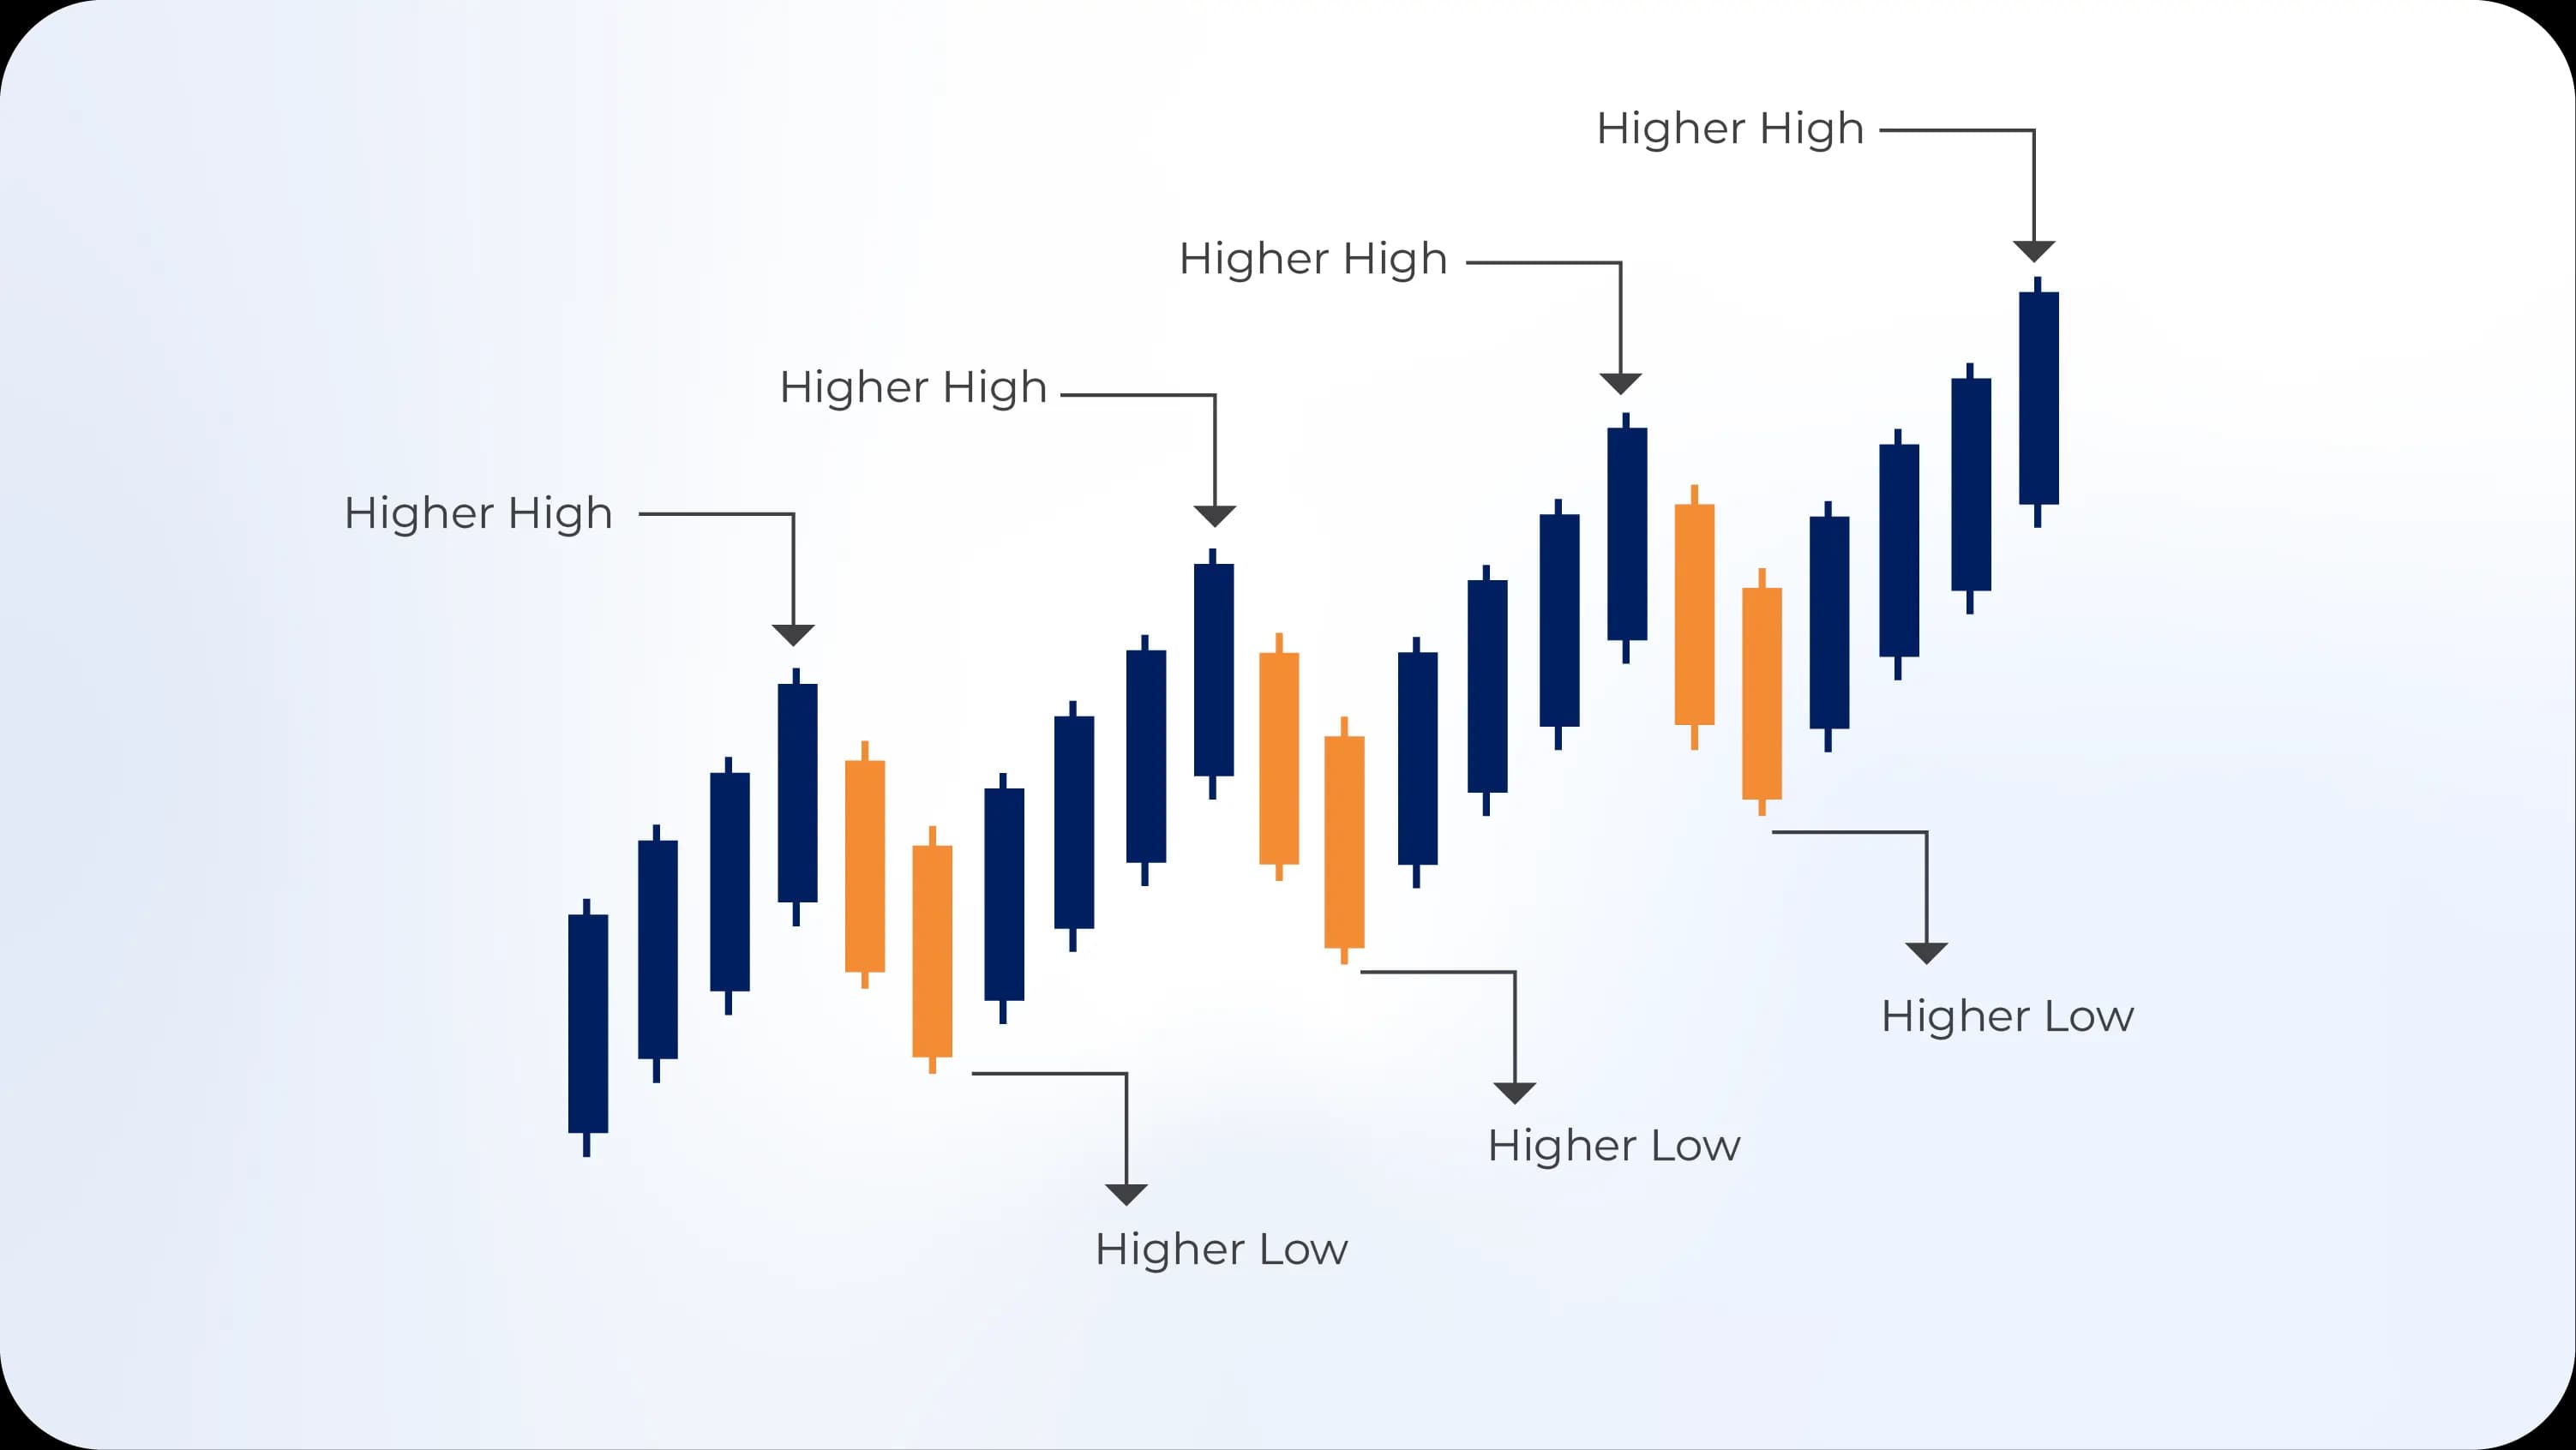
When traders talk about trends, they're really talking about higher highs and higher lows (for uptrends) or lower highs and lower lows (for downtrends). These patterns create the visual roadmap that tells you what's happening beneath the surface of all that price chaos.
Think of a trend like a staircase. In an uptrend, each step takes you higher—even if you occasionally slip back a bit. In a downtrend, you're descending those stairs, step by step. And sometimes? You're just standing on a flat landing, waiting for the next flight of stairs to appear. That's your sideways market.
Related Article: Technical Analysis: Your Complete Guide to Reading Market Charts
Why Trends Form
Markets trend because of one simple truth: sentiment doesn't change overnight. When traders collectively believe the euro is getting stronger against the dollar, they buy. And they keep buying. That collective action pushes prices higher, creating an uptrend. The opposite happens when pessimism takes over.
Economic data, central bank decisions, geopolitical events—these all feed into market sentiment and create the conditions for trends to develop and persist. A single news headline might cause a quick spike, but sustained trends require sustained conviction from market participants.
Uptrend: Riding the Bull
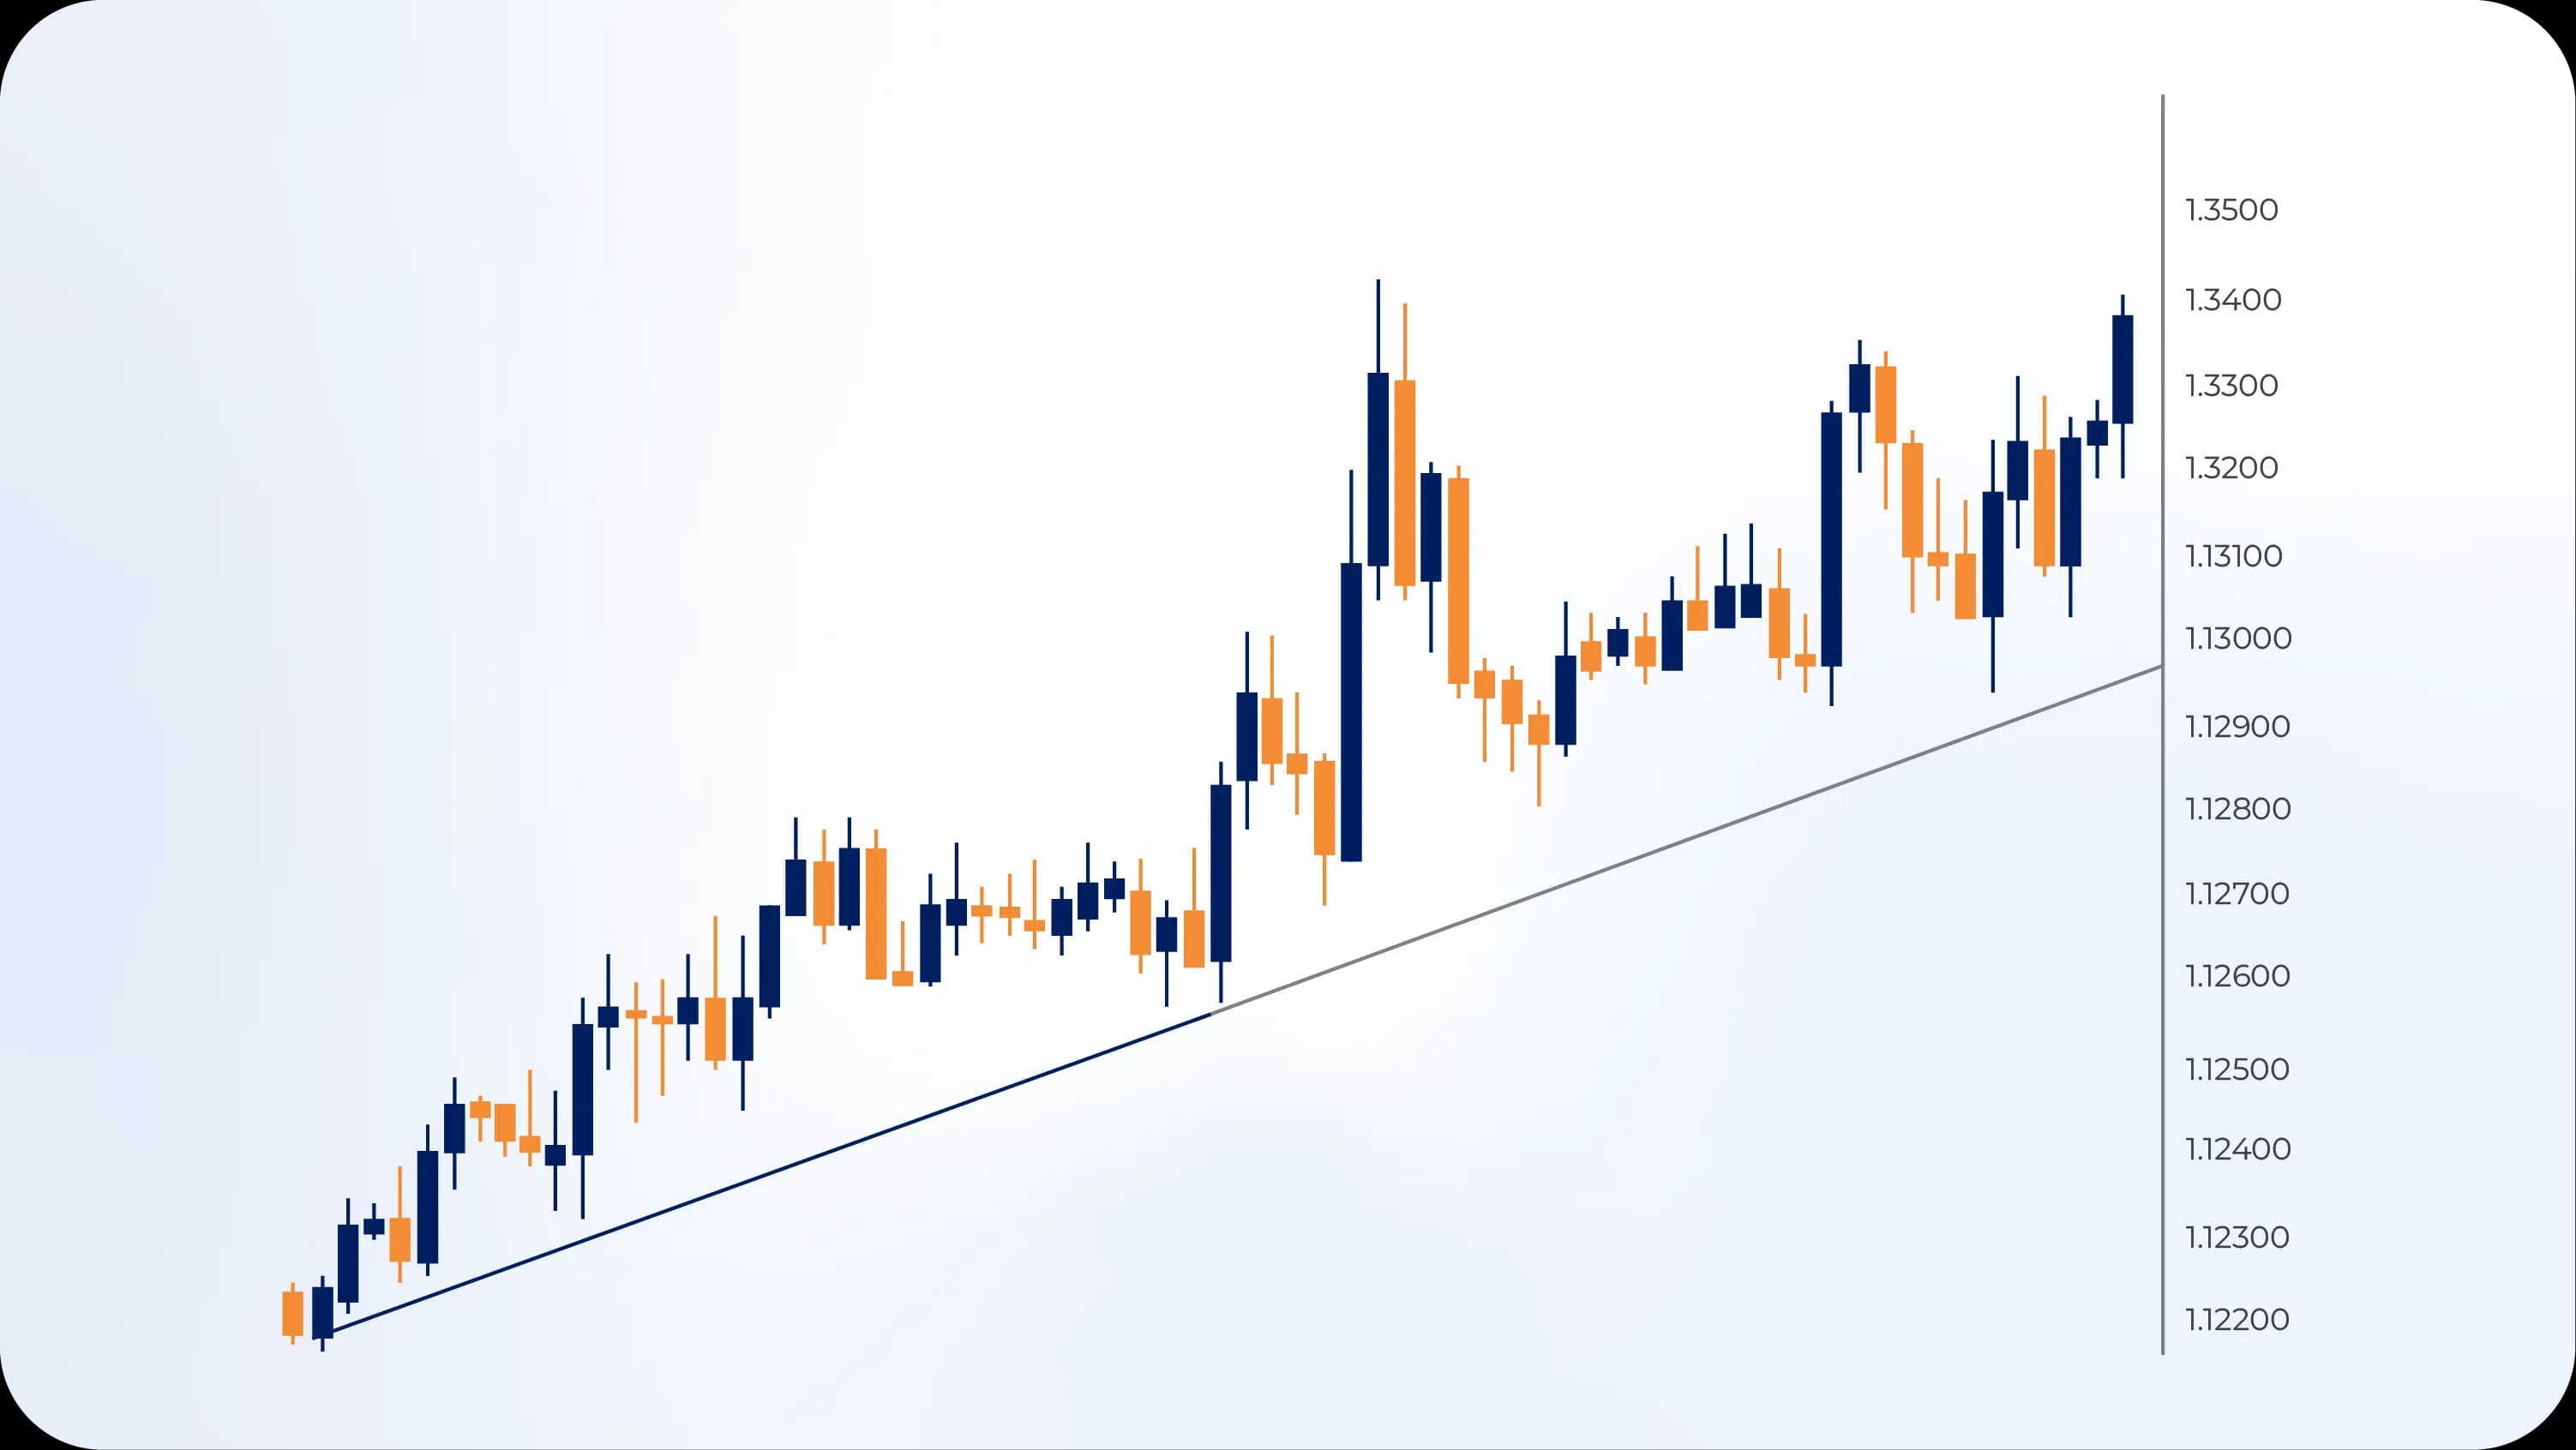
An uptrend is what every trader dreams about catching. It's that sweet spot where you buy low, watch your position climb, and sell high. Sounds simple, right? Well, it can be—if you know what to look for.
Characteristics of an Uptrend
An uptrend forms when prices consistently make higher highs and higher lows. Imagine a bouncing ball that's also rolling uphill. Each bounce might be a little lower than the peak before it, but the overall trajectory keeps climbing. That's your uptrend in action.
Here's what you'll typically see:
- Price peaks that surpass previous peaks
- Pullbacks that don't drop below previous lows
- Increasing volume on upward moves
- Momentum indicators pointing north
- Positive news or economic data supporting the currency
The trick with uptrends isn't just spotting them—it's joining them at the right time. Jump in too early during the initial formation, and you might catch a false start. Wait too long, and you're buying at the top just before the reversal. Timing matters.
Trading an Uptrend
I'll be straight with you: the best approach to trading uptrends is annoyingly simple—buy the dips. When an uptrend is established and price pulls back to a support level (like a moving average or previous low), that's your entry signal. You're essentially getting a discount on an asset that's already proven it wants to go higher.
Let's say EUR/USD has been climbing steadily for weeks. You see higher highs, higher lows, the whole package. Then one morning, it drops 50 pips on some random ECB comment that doesn't really change the bigger picture. That dip? That's opportunity knocking. You buy there, place your stop loss below the recent swing low, and ride the next leg up.
Your exit strategy? That depends on your style. Some traders take profits at previous resistance levels. Others trail their stops upward as the trend continues, letting the market push them out when momentum finally fades. There's no "right" answer—just what works for your risk tolerance and trading plan.
Common Uptrend Mistakes
Even experienced traders mess this up sometimes. The biggest mistake? Trying to pick the top. You see an uptrend that's been running for a while, and you think, "This has to reverse soon, right?" So you start shorting it. And you get demolished. Remember: the trend is your friend until it's not. Don't fight it just because it "feels" extended.
Another trap is ignoring the broader timeframe. What looks like an uptrend on a 15-minute chart might just be a minor correction within a daily downtrend. Always zoom out and check multiple timeframes before committing capital.
Downtrend: When Gravity Takes Over
Downtrends are uptrends in reverse—and they often move faster. Why? Fear is a stronger emotion than greed. When traders panic and rush for the exits, prices can plummet with shocking speed. Understanding downtrends is crucial because they represent half of all tradable opportunities in forex.
Anatomy of a Downtrend
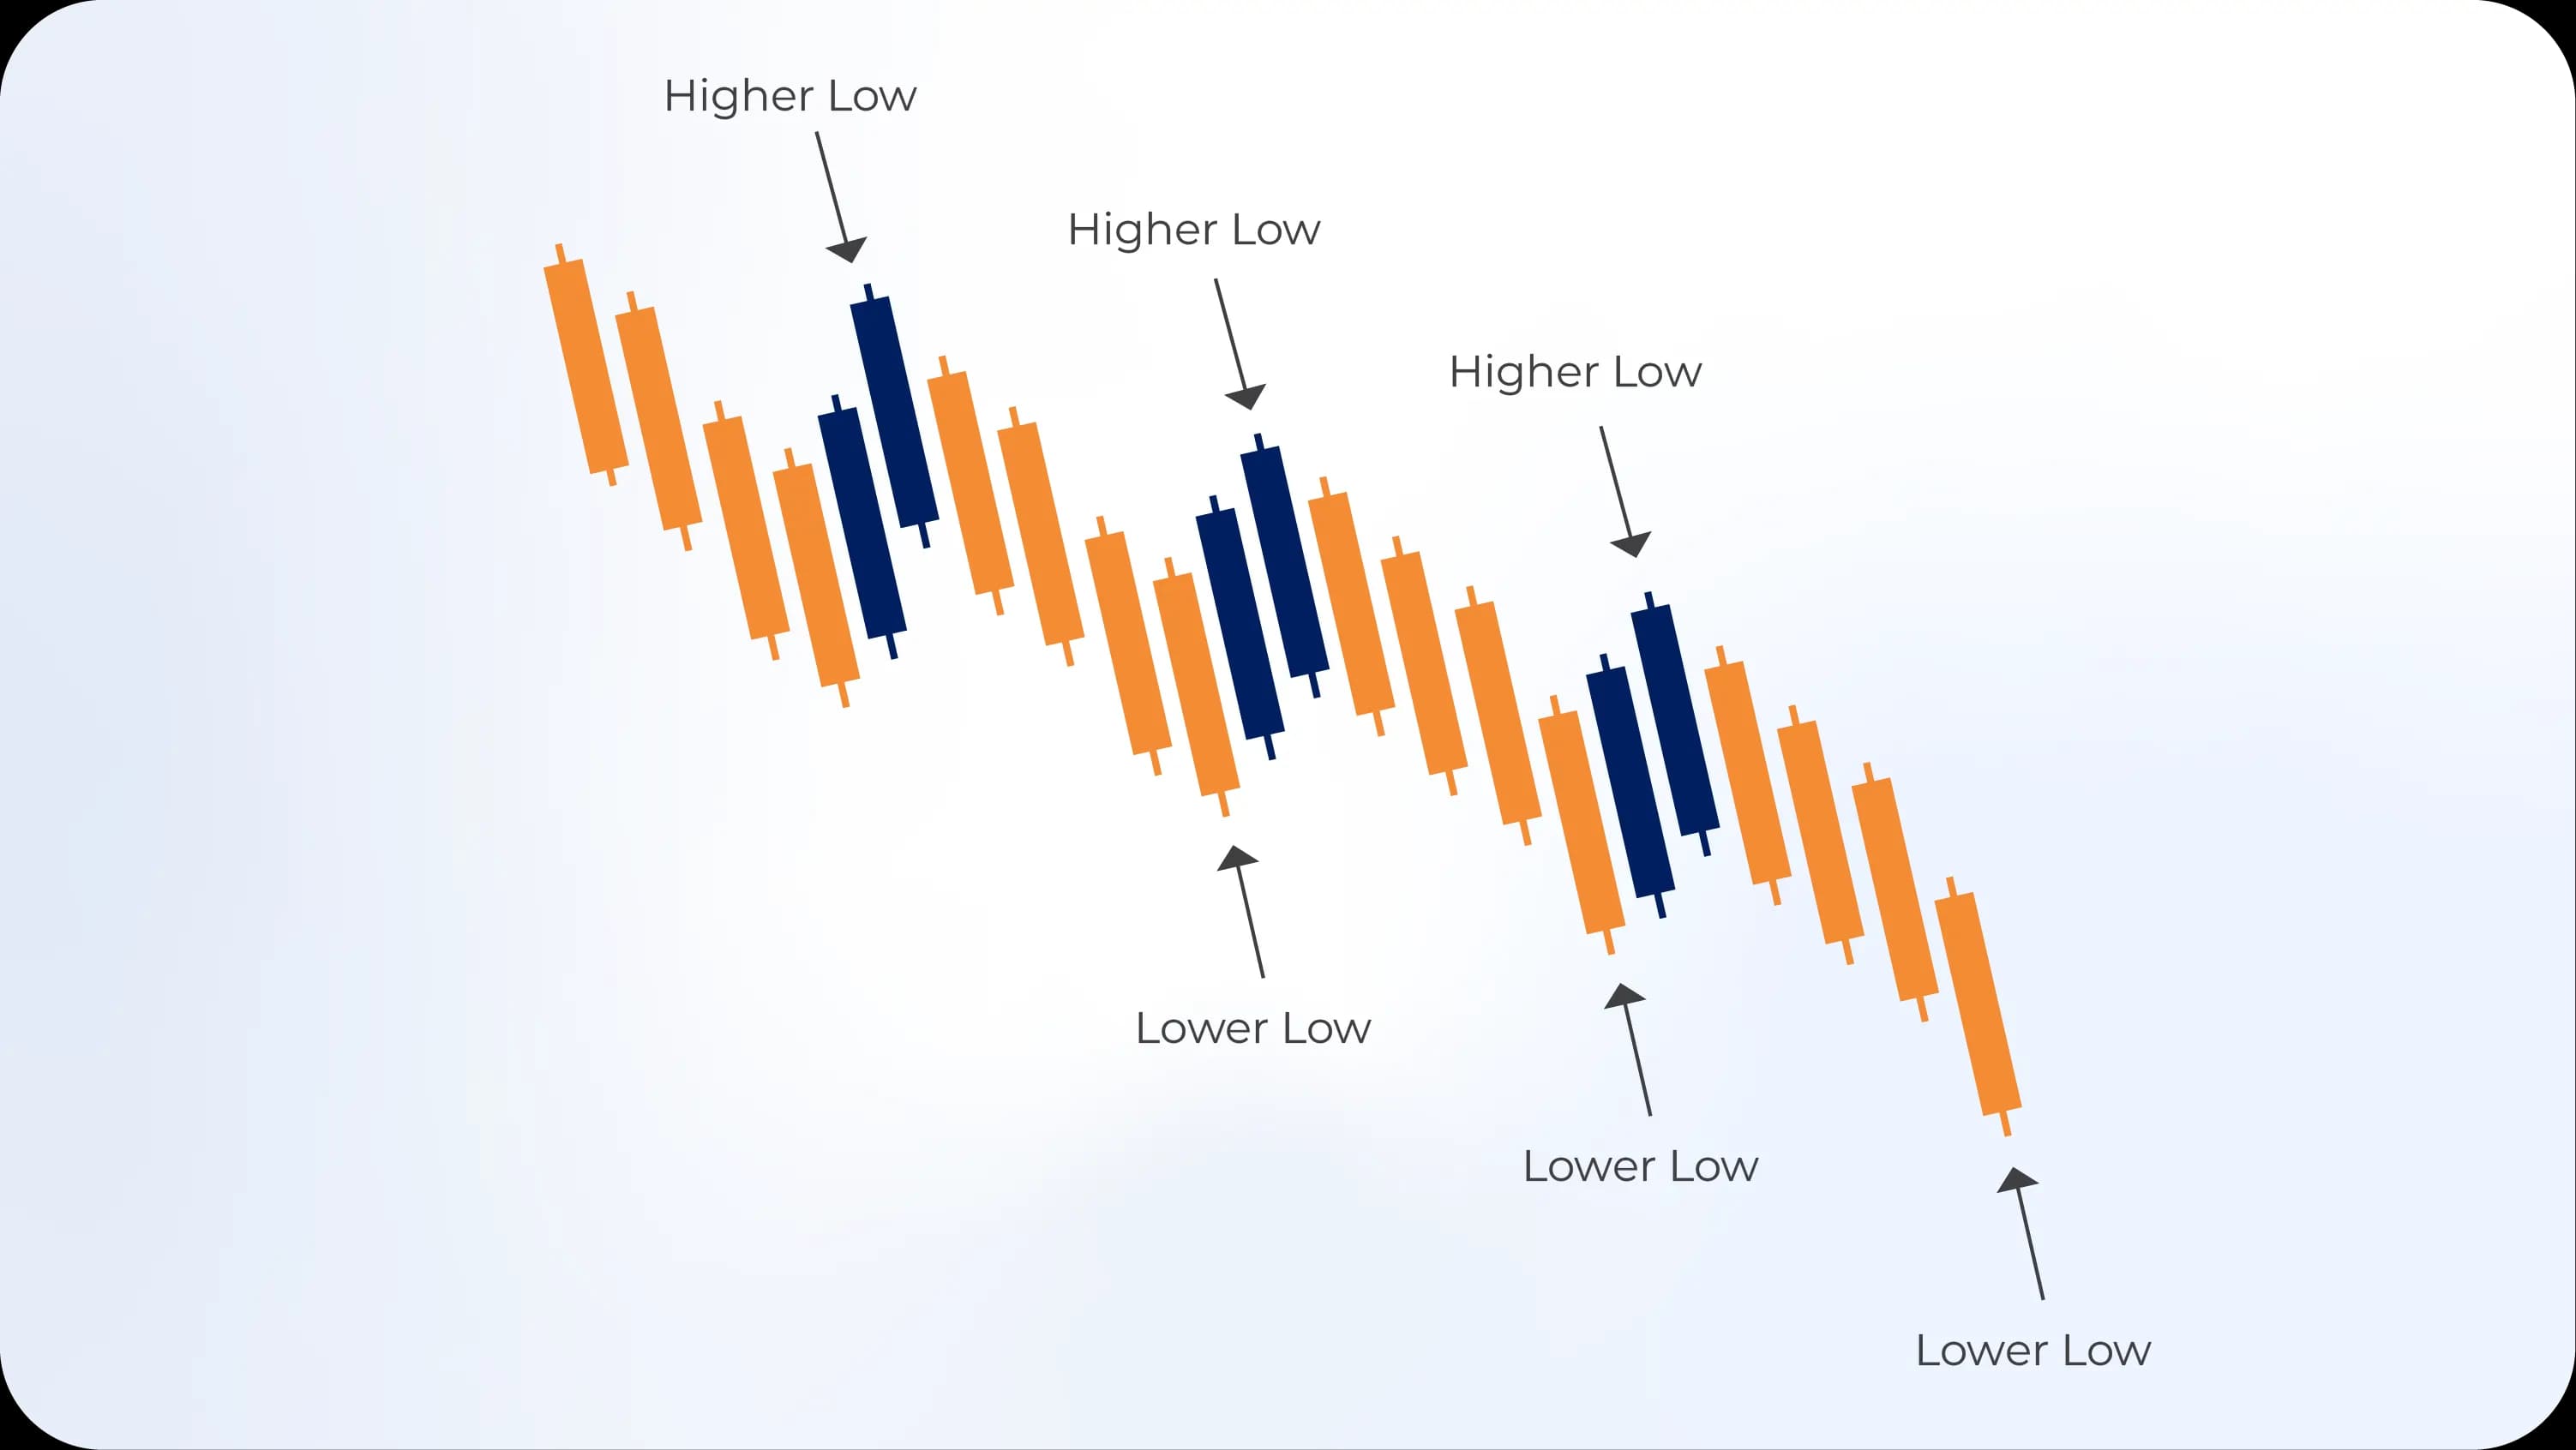
A downtrend establishes itself through lower highs and lower lows. Each rally attempt fails to reach the previous peak, and each subsequent drop takes prices to new lows. It's like watching a stone roll downhill, occasionally bouncing off rocks but never regaining its starting height.
Key characteristics include:
- Price peaks that fail to exceed previous peaks
- Bounces that quickly lose momentum
- Increasing volume on downward moves
- Negative divergence on oscillators
- Pessimistic news flow or deteriorating economic conditions
The psychology behind downtrends is fascinating. Once traders smell blood in the water, they pile on. Short sellers push prices lower, which triggers stop losses from long positions, which pushes prices even lower. It's a self-reinforcing cycle that can feel relentless if you're on the wrong side.
Read More: How Does Trading Psychology Work?
Trading a Downtrend
The golden rule for downtrends mirrors the uptrend strategy: sell the rallies. When a downtrend is clearly established, any upward bounce should be viewed as a potential shorting opportunity rather than the start of a reversal.
Here's the playbook: you identify a clear downtrend with multiple lower highs and lower lows. Then you wait. Patience is crucial here. Eventually, you'll see a relief rally—maybe some short covering or a brief positive headline. Prices climb 30, 40, maybe 50 pips. That's your cue. You short at or near the resistance level (could be a previous low that's now acting as resistance, or a descending trendline), set your stop above the recent high, and collect profits as gravity reasserts itself.
The challenge with downtrends is managing the emotional rollercoaster. Watching your short position climb against you during a bounce tests your discipline. That's why having a solid stop loss and trusting your analysis matters so much.
Downtrend Duration
Here's something that surprises newer traders: downtrends often don't last as long as uptrends, but they're more violent. A currency pair might grind higher for six months, then give back all those gains in six weeks. The intensity difference is real.
This happens because fear and panic create urgency. Greed, on the other hand, builds slowly. Traders take their time getting in during uptrends, carefully evaluating positions. But when things turn south? Everyone rushes for the door simultaneously.
Sideways: The Patience Game
If uptrends are exciting and downtrends are nerve-wracking, sideways markets are... boring. And that's exactly the problem. Most traders lose money in sideways markets because they're trying to trade trends that don't exist.
Understanding Range-Bound Markets
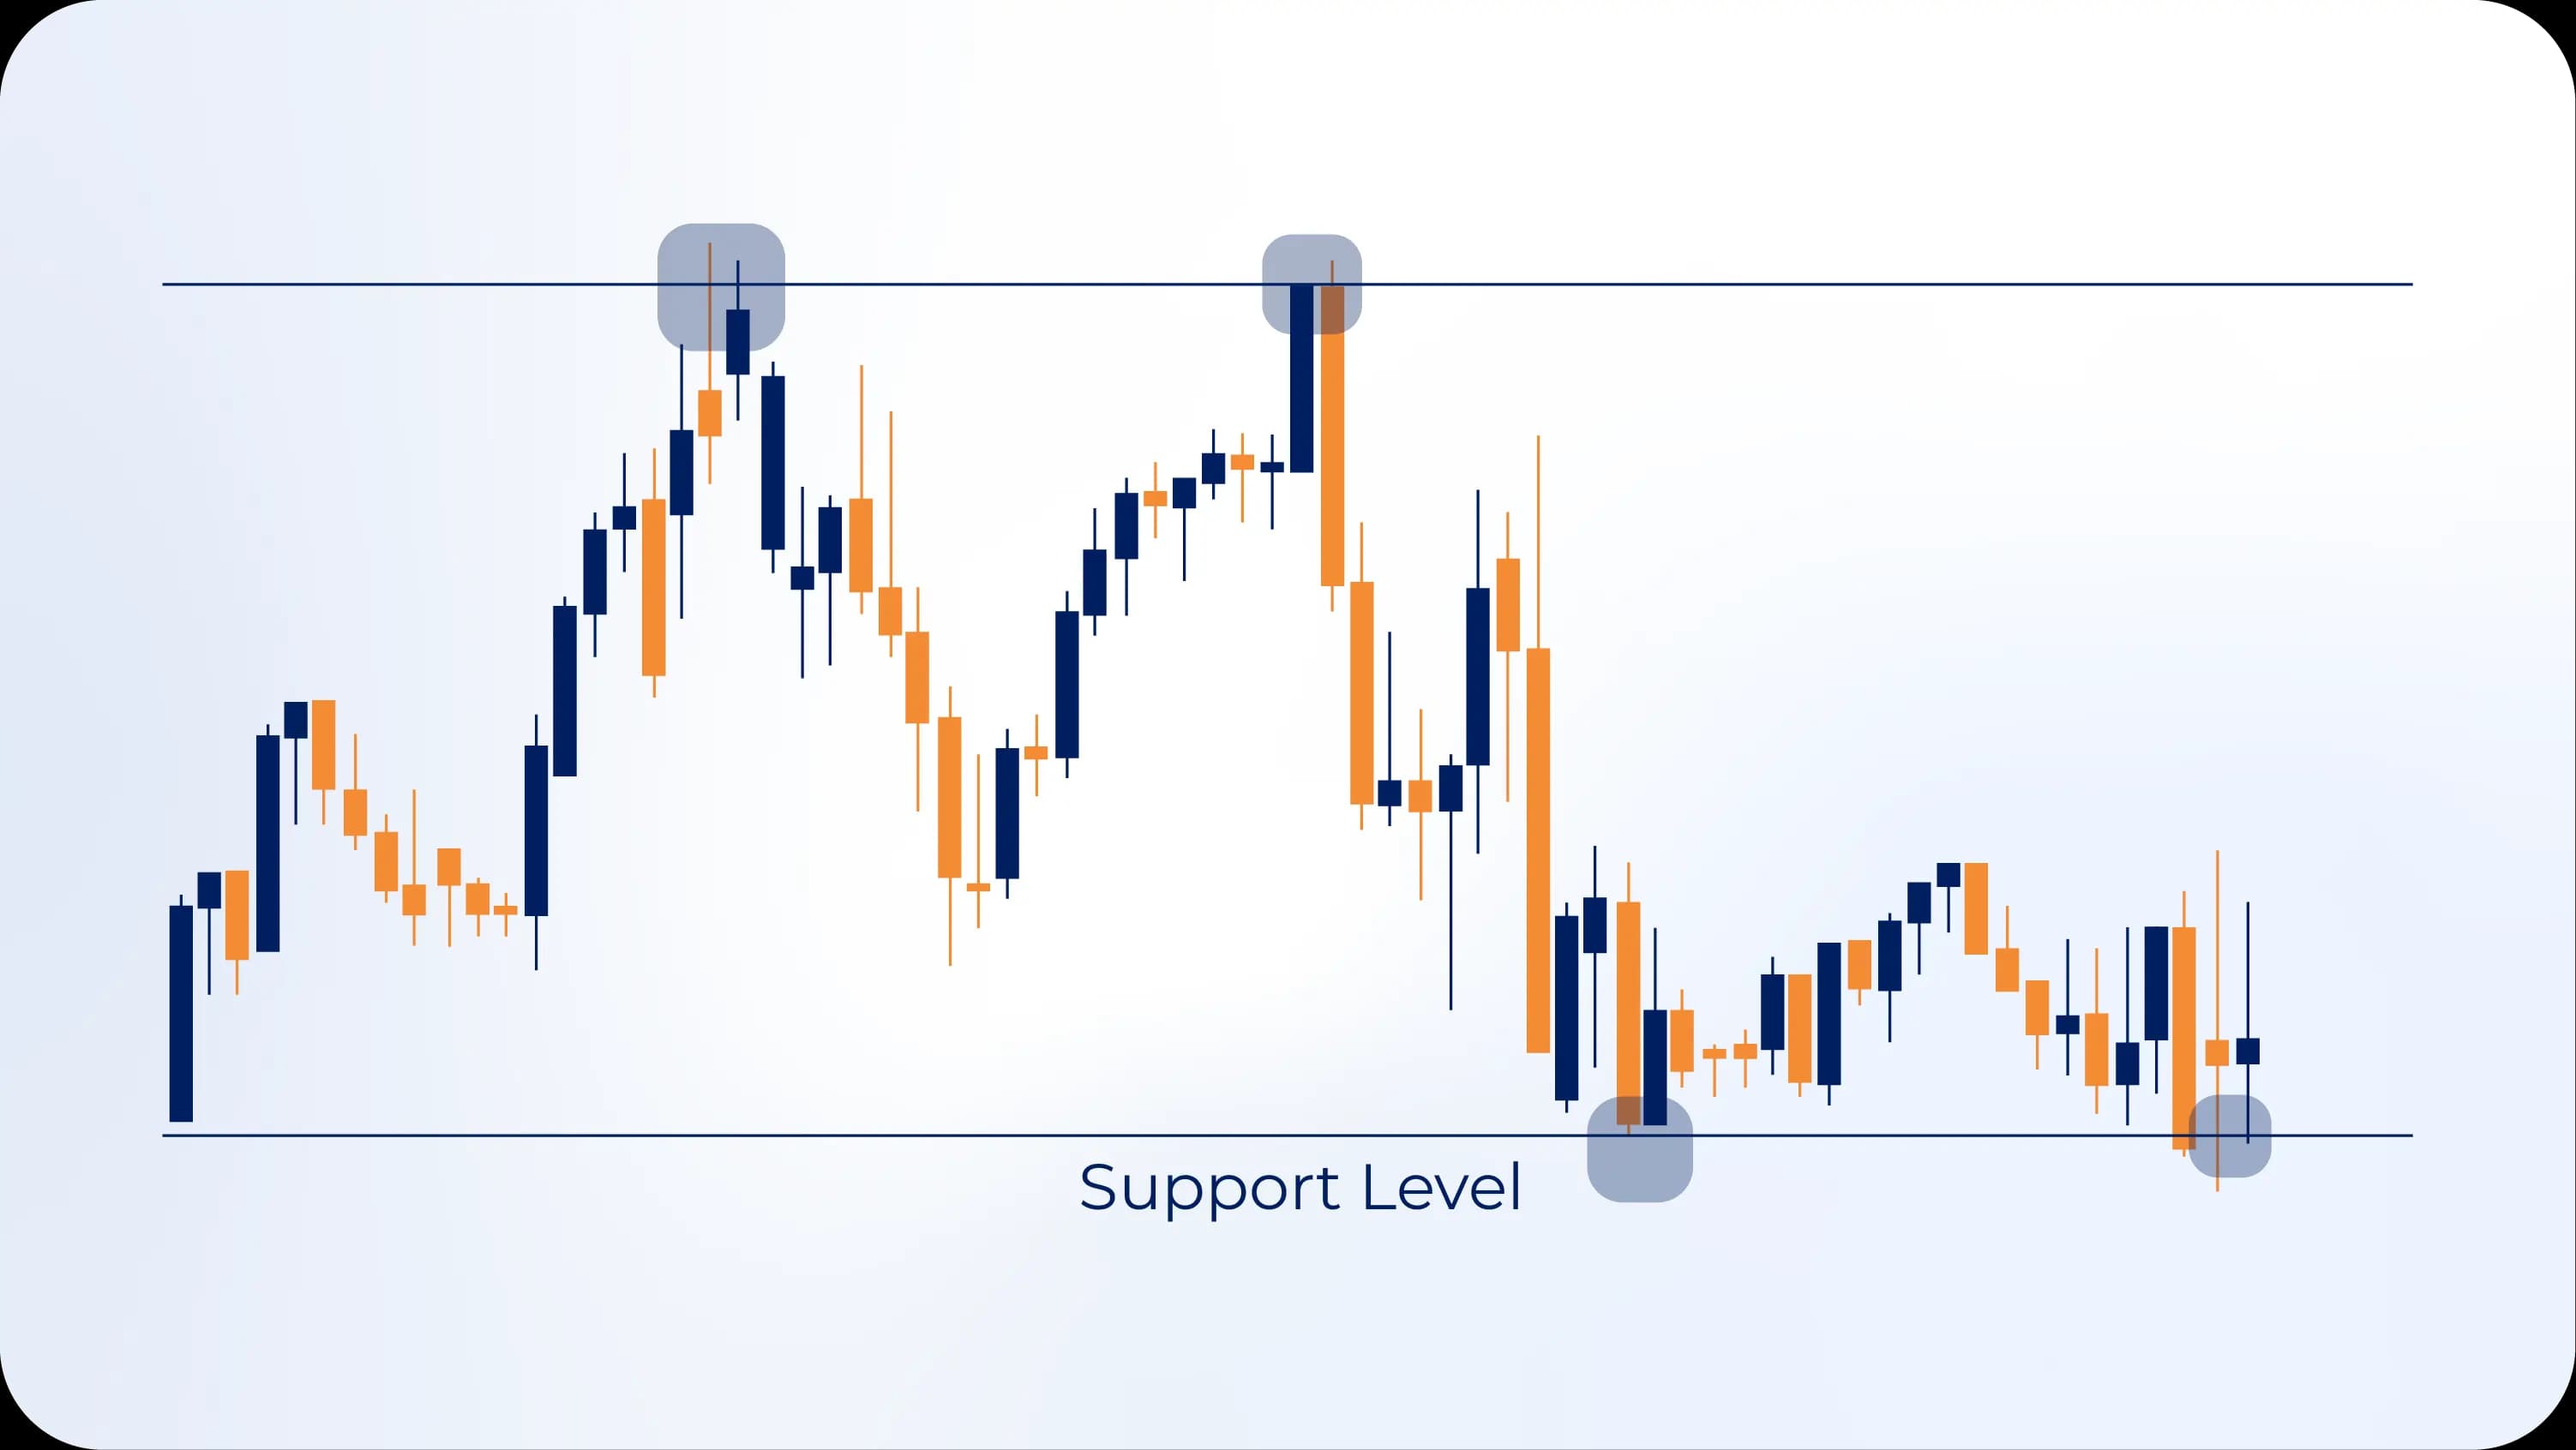
A sideways market (also called a consolidation or range) occurs when prices bounce between defined support and resistance levels without making significant progress in either direction. Picture a tennis ball bouncing between two walls—it's active, but it's not actually going anywhere.
These markets form when:
- Bulls and bears are equally matched
- Traders await important news or data
- Previous trend momentum has exhausted itself
- Major support and resistance levels contain price action
The visual pattern is unmistakable once you know what to look for. You'll see prices hit a ceiling (resistance), drop back down, hit a floor (support), bounce back up, rinse and repeat. Sometimes this continues for days, weeks, or even months.
Trading Sideways Markets
Trading ranges requires a completely different mindset from trend trading. Instead of buying dips and selling rallies with the hope of continuation, you're doing the opposite—buying at support and selling at resistance, assuming prices will reverse.
The strategy is straightforward: identify the range boundaries, then take contrarian positions at the extremes. When price hits the bottom of the range, you buy. When it reaches the top, you sell. Your stops go just beyond the range boundaries because if price breaks those levels, the range is dead and you need to exit immediately.
But here's the catch—and it's a big one—you need to be absolutely certain you're in a range. Too many traders see a couple of bounces and assume they've found a sideways market, only to discover they're actually in a trend that's pausing before its next big move. Confirmation is everything.
The Breakout Play
The most profitable aspect of sideways markets isn't trading the range itself—it's catching the breakout. When prices finally escape their prison, they often move explosively in the breakout direction. That pent-up energy from all those traders stuck in the range needs somewhere to go.
Smart traders watch for breakout signals: increasing volume, a decisive candle close beyond support or resistance, or momentum indicators showing strength. When these align, forget the range and jump on the new trend as it forms.
Trendline: Your Visual Guide
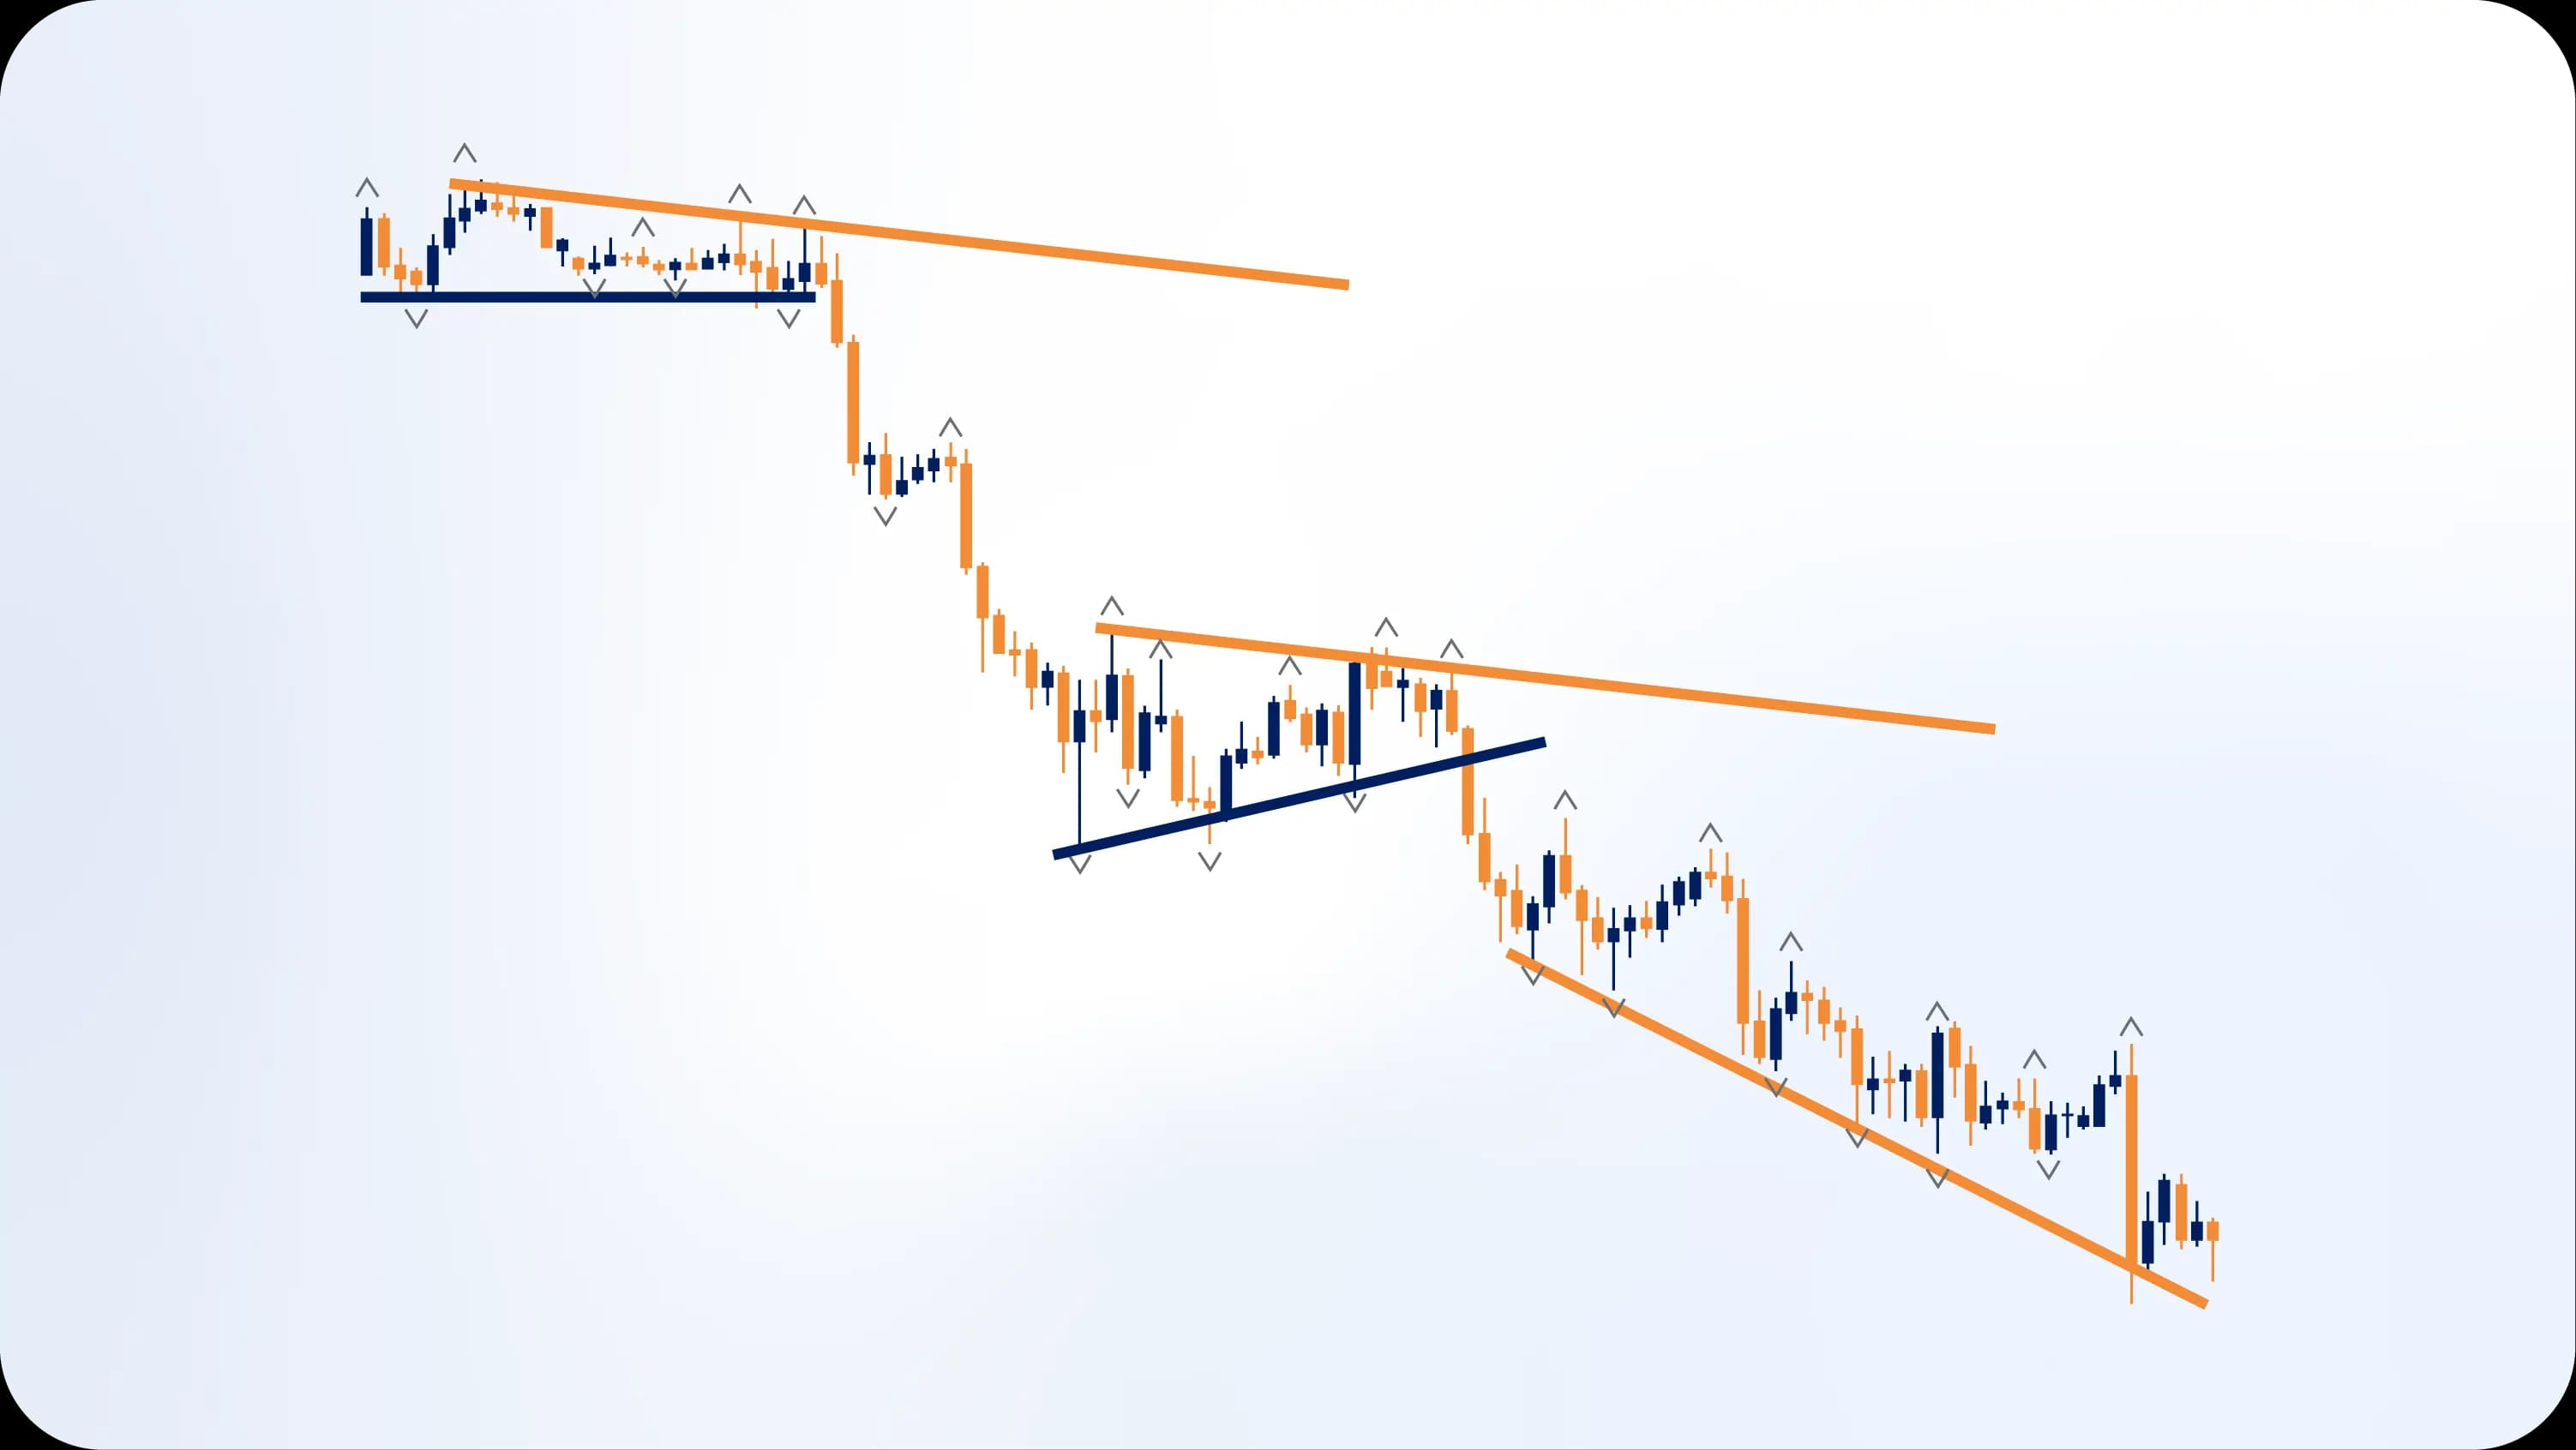
Now we get to the tactical tools. Trendlines are simple diagonal lines you draw on charts to visualize trend direction and strength. They're deceptively powerful—just two points connected by a line can tell you where to enter trades, where to exit, and when the party might be ending.
Drawing Trendlines Correctly
Drawing trendlines is an art masquerged as science. Here's the basic approach:
For uptrends: Connect two or more swing lows with a straight line extending into the future. This line becomes your support level—the floor that price tends to respect during pullbacks.
For downtrends: Connect two or more swing highs with a descending line. This becomes your resistance level—the ceiling that caps rally attempts.
The key word in both cases? Respect. A good trendline should have multiple touches where price bounced off it. Two touches create the line, but three or more touches validate it. Each time price respects your trendline, it becomes more significant.
Common Trendline Mistakes
I see traders mess this up constantly. They force trendlines through price action, cherry-picking the exact points that make their line look perfect while ignoring all the violations. That's not analysis—that's wishful thinking.
Another issue: drawing trendlines on tiny timeframes. A trendline on a 5-minute chart means almost nothing in the grand scheme of things. Focus on hourly, 4-hour, and daily charts where patterns have actual significance.
And please, stop redrawing your trendlines every time price breaks them slightly. A trendline violation is a signal, not an invitation to adjust your line. If price breaks your trendline, acknowledge it and reassess your position.
Trendline Angles Matter
Here's something subtle but important: the angle of your trendline tells you about trend sustainability. Steep trendlines (sharp angles) indicate aggressive momentum that's hard to maintain. These trends often burn bright and fast before correcting sharply.
Moderate trendlines (45-degree-ish angles) suggest sustainable trends with healthy momentum. These are the trends you want to ride because they tend to last longer.
Shallow trendlines (nearly flat) indicate weak trends that might not offer much profit potential. They're better suited for range-trading approaches.
Effective Trend Trading Strategies
Theory is great, but let's talk practical application. How do you actually turn trend knowledge into profitable trades? Here are battle-tested strategies that work across different market conditions.
The Trend-Following System
This is the bread and butter of successful forex trading. The concept: identify strong trends and ride them until they end. Simple? Yes. Easy? Not quite.
Start by identifying the trend on your chosen timeframe. Use price action (those higher highs and higher lows we discussed) combined with at least one indicator for confirmation. Once you've confirmed the trend, you wait for pullbacks to your entry zone—typically a support level in an uptrend or resistance in a downtrend.
Your entry trigger might be a specific candlestick pattern, a bounce off a moving average, or momentum indicators turning back in the trend direction. Once you're in, you manage the trade by trailing your stop loss as the trend progresses. Your exit comes when the trend shows definitive signs of reversal—a break of your trendline, a change in market structure, or momentum indicators rolling over.
Breakout Trading
Breakouts from consolidation patterns offer some of the best risk-reward setups in forex. The idea: enter when price breaks decisively beyond established support or resistance.
Identify a clear consolidation pattern—could be a rectangle, triangle, or any defined range. Watch for volume to dry up as the pattern develops, indicating traders are genuinely undecided. Then wait for the breakout.
The breakout itself should be decisive—a strong candle close beyond the boundary with increasing volume. Many traders wait for a retest of the broken level (support turning into resistance, or vice versa) before entering. This reduces false breakout risk.
Your stop goes on the opposite side of the broken level, and your target is typically at least the height of the consolidation pattern added to your entry price. Some traders hold longer if the breakout develops into a strong trend.
The Moving Average Crossover
This classic strategy uses two moving averages—a fast one (like a 20-period) and a slow one (like a 50-period). When the fast MA crosses above the slow MA, it signals a potential uptrend. When it crosses below, a downtrend might be forming.
The beauty of this approach is its simplicity and objectivity. The crossover either happens or it doesn't—no interpretation required. The downside? It lags price action, so you'll never catch the absolute beginning of a trend, and you'll give back some profit before exit signals trigger.
Combine MA crossovers with price action confirmation for better results. If you get a bullish crossover but price is making lower lows, that's a red flag suggesting the signal might fail.
The Pullback Entry
This is my personal favorite because it offers better risk-reward than chasing trends. Here's how it works:
First, identify a strong trend. Wait for an impulsive move in the trend direction—this proves momentum exists. Then be patient. Price will eventually pull back, either due to profit-taking or temporary doubt. This pullback is your opportunity.
Watch for the pullback to reach a logical support/resistance area—could be a Fibonacci retracement level (50% or 61.8% are popular), a previous structure level, or a moving average. When price reaches that zone and shows signs of resuming the trend (bullish candle patterns in an uptrend, for example), you enter.
Your stop goes just beyond the pullback low (for uptrends) or high (for downtrends), and your target is the next structure level in the trend direction. This strategy offers tight stops with extended profit targets—the recipe for long-term profitability.
StrategyBest Market ConditionRisk LevelTime CommitmentSkill LevelTrend FollowingStrong trendsMediumLow-MediumBeginner-IntermediateBreakout TradingConsolidation to trendHighMediumIntermediateMA CrossoverTrending marketsLow-MediumLowBeginnerPullback EntryEstablished trendsLow-MediumMedium-HighIntermediate-Advanced
Trend Indicators: Confirming What You See
Your eyes can spot trends, but indicators add an extra layer of confidence. They quantify what you're seeing visually and often catch things human perception misses. Let's break down the most effective trend indicators for forex trading.
Moving Averages (MA)
If you only learn one indicator, make it moving averages. These smooth out price action by calculating the average price over a specific period, creating a line that filters out noise and highlights direction.
Simple Moving Average (SMA) treats all prices equally. A 50-day SMA adds up the last 50 closing prices and divides by 50. It's straightforward but lags significantly behind price.
Read More: Simple Moving Average: Your Ultimate Guide to Trading Success
Exponential Moving Average (EMA) gives more weight to recent prices, making it more responsive to current price action. Many forex traders prefer EMAs because they react faster to trend changes.
Use MAs as dynamic support/resistance levels. In an uptrend, price often bounces off the 20 or 50 EMA during pullbacks. In a downtrend, these same MAs act as resistance. When price crosses decisively through a major MA, it often signals trend change.
Related Article: Mastering the Best EMA for 5 Minute Charts
Relative Strength Index (RSI)
The RSI measures momentum on a scale from 0 to 100, showing whether a currency pair is overbought (above 70) or oversold (below 30). But here's the crucial insight most beginners miss: in strong trends, traditional overbought/oversold levels don't matter much.
During powerful uptrends, RSI can stay above 70 for extended periods. Trying to fade the trend just because RSI is "overbought" is a recipe for losses. Instead, use RSI to confirm trend strength. If price is making new highs but RSI fails to make new highs, that bearish divergence suggests weakening momentum—a potential early warning of trend exhaustion.
Moving Average Convergence Divergence (MACD)
The MACD tracks the relationship between two moving averages (typically the 12 and 26 EMA), displaying it as a histogram and signal line. When the MACD line crosses above the signal line, it suggests bullish momentum. Below? Bearish momentum.
What makes MACD valuable for trend traders is its ability to show momentum shifts before they're obvious in price. The histogram—the difference between the MACD and signal lines—visually represents momentum strength. Growing histogram bars mean momentum is increasing. Shrinking bars suggest momentum is fading.
Watch for MACD divergences just like with RSI. When price makes a new extreme but MACD doesn't, the trend is likely running out of gas.
Average Directional Index (ADX)
Unlike other indicators that tell you trend direction, ADX tells you trend strength. It ranges from 0 to 100, with readings above 25 suggesting a strong trend and readings below 20 indicating a weak or sideways market.
Here's why this matters: not all trends are worth trading. A weak trend with ADX at 15 might chop you up with false signals. But when ADX climbs above 25 or 30, you know real directional movement exists, making trend-following strategies more reliable.
Combine ADX with directional indicators (+DI and -DI) for complete picture. When ADX is rising, +DI is above -DI, and price is making higher highs, you've got confirmation of a strong uptrend worth trading.
Indicator Combinations That Work
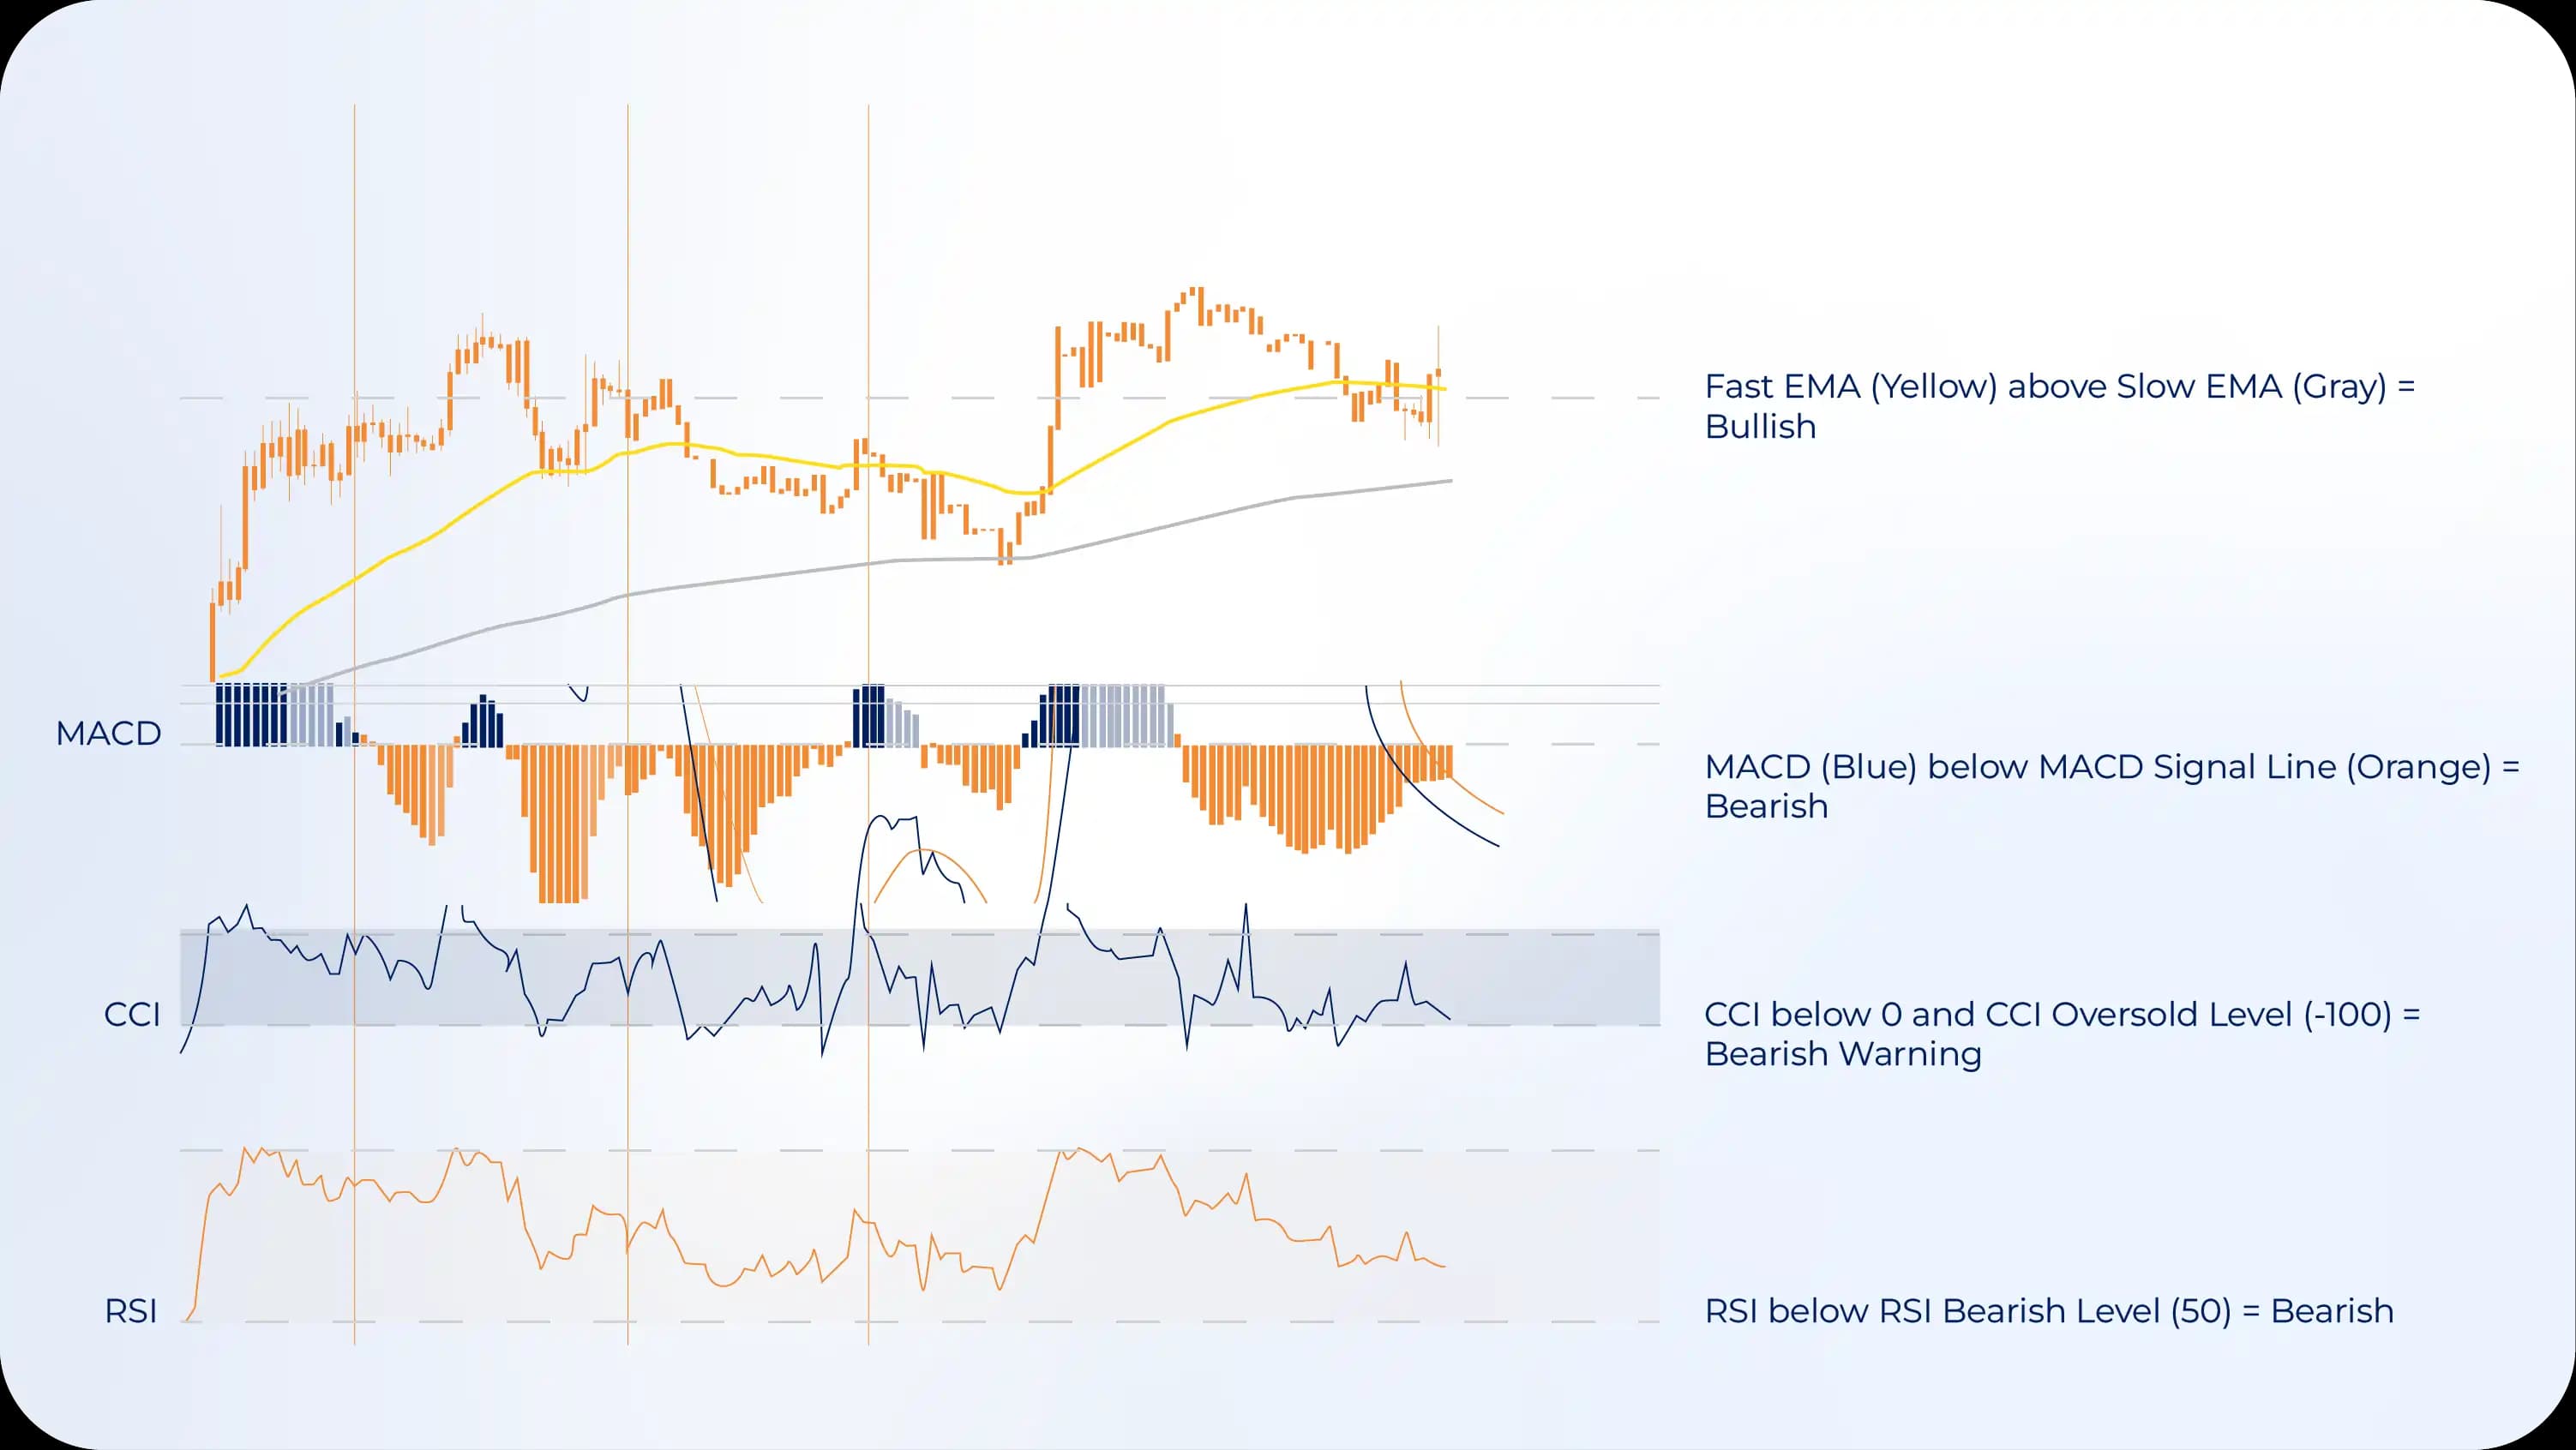
Don't use indicators in isolation. Combine them for stronger signals:
Trend + Momentum: Use a moving average to identify trend direction, then wait for RSI or MACD to confirm momentum in that direction before entering.
Multiple Timeframes: Check if indicators on both your trading timeframe and the timeframe above agree. If the 4-hour chart shows a strong uptrend on ADX and MACD, and the daily chart confirms it, you've got conviction.
Price Action + Indicator: Never enter based solely on indicators. Wait for price action confirmation—a bullish candle pattern, a trendline bounce, or a structure break—before pulling the trigger.
Frequently Asked Questions About Trends
How long do trends typically last in forex?
There's no standard duration because trends are driven by fundamental factors that vary wildly. Short-term trends on intraday charts might last hours or days. Intermediate trends can persist for weeks or months. Major trends driven by economic policy shifts or geopolitical changes sometimes last years. The EUR/USD downtrend from 2014-2017, for example, ran for over three years. Rather than trying to predict how long a trend will last, focus on following it until it gives clear signs of ending.
Can trends be predicted before they start?
Not reliably. You can identify conditions that favor trend development—like upcoming economic events or technical breakout patterns—but prediction is different from reaction. Successful traders don't predict trends; they recognize them early and position accordingly. The faster you identify a new trend after it starts, the more of it you'll capture. Trying to predict trends before they begin usually means trading false starts and losing money.
What percentage of the time are forex markets trending?
This might shock you: markets spend roughly 30-40% of the time in clear trends and 60-70% in consolidation or choppy conditions. This is why trend following, despite being simple in concept, isn't easy in practice. You'll encounter many periods where there's nothing worth trading. Patience and selectivity separate profitable trend traders from those who overtrade and give back their gains.
How do I know when a trend is ending?
Watch for multiple confirmation signals: (1) Break of the major trendline, (2) Failure to make a new high in an uptrend (or new low in a downtrend), (3) Momentum indicators diverging from price, (4) Moving average crossovers in the opposite direction, (5) Change in market structure—like higher highs and higher lows transitioning to lower highs. No single signal guarantees a reversal, but when several align, it's time to tighten stops or exit positions.
Should I trade against trends?
Occasionally trading against trends—counter-trend trading—can be profitable, but it requires exceptional timing and tight risk management. Most traders should focus on trading with trends because probabilities are in your favor. If you do trade counter-trend, only do it when you have multiple signals suggesting a reversal, keep position sizes smaller than your trend trades, and use very tight stops. Remember: trying to catch exact tops and bottoms is how accounts get blown up.
What's the best timeframe for trend trading?
It depends on your trading style and availability. Day traders might focus on 15-minute to 1-hour charts for intraday trends. Swing traders typically use 4-hour and daily charts for trends lasting days to weeks. Position traders rely on daily and weekly charts for long-term trends. Start with the daily chart to identify the major trend, then drop to lower timeframes to time your entries. Trading with the daily trend increases your odds significantly.
Do all currency pairs trend equally?
No. Some pairs trend better than others. Major pairs like EUR/USD, GBP/USD, and USD/JPY tend to have cleaner trends because they're more liquid and influenced by clear macroeconomic factors. Exotic pairs can trend too, but they're often choppier and more susceptible to sudden reversals. Cross pairs (pairs not involving USD) sometimes offer the strongest trends when there's clear economic divergence between the two countries.
Conclusion: Mastering the Art of Trend Trading
Let's bring this full circle. Trends aren't mysterious forces—they're simply the market's way of expressing collective opinion about currency values. Your job as a trader isn't to predict where trends will go but to identify them, respect them, and profit from them.
The principles we've covered aren't complicated. Uptrends show strength through higher highs and higher lows. Downtrends demonstrate weakness through the opposite pattern. Sideways markets signal indecision and often precede explosive moves. Trendlines and indicators help you visualize and confirm what price action is telling you.
But here's the truth: knowing about trends and successfully trading them are completely different things. Knowledge must transform into disciplined action. That means waiting patiently for quality setups instead of forcing trades. It means taking losses when you're wrong without ego or hesitation. It means letting winners run even when every instinct screams to take profit early.
Start small. Focus on one currency pair and one trend trading strategy. Master that before expanding. Keep a trading journal documenting every trade—your entry reasoning, your emotions during the trade, your exit decision. Over time, patterns emerge showing what works for you and what doesn't.
And remember: the forex market isn't going anywhere. There will always be another trend, another opportunity. The traders who succeed aren't the ones who catch every move—they're the ones who consistently execute their strategy, manage risk intelligently, and stay in the game long enough for their edge to express itself.
So here's my challenge to you: open your charts right now. Identify the trend on three different currency pairs using the techniques we've discussed. Don't place any trades yet—just observe. Draw trendlines. Note the structure. Watch how price respects (or violates) those levels. Do this for a week, and you'll start seeing the market through a completely different lens.
The markets reward patience, discipline, and consistency. Trends are your roadmap to profitability—if you learn to read them correctly and trade them wisely. Now get out there and start paying attention to what the market is actually telling you.
Ready to level up your trading? Start applying these trend concepts today, track your observations, and watch your market understanding deepen. The best trend of all is the one you catch next.
