Technical Analysis Reversal Patterns: A Complete Guide for Forex Traders
Technical analysis reversal patterns serve as critical indicators that signal potential trend exhaustion and upcoming directional changes in forex markets. These chart formations emerge when buying or selling pressure diminishes, creating specific geometric shapes that experienced traders recognize as opportunities to enter or exit positions. Understanding these patterns enables traders to anticipate market turning points, manage risk effectively, and capitalize on significant price movements before they fully materialize.


Introduction
Market trends do not persist indefinitely. Eventually, every uptrend exhausts itself, and every downtrend finds support. The transition between these directional movements creates specific chart patterns that technical analysts have documented and studied for decades. These formations, known as reversal patterns, represent the battleground where bulls and bears contest control of price direction.
Reversal patterns develop through a recognizable sequence of price action that reflects changing market psychology. As a trend matures, momentum weakens, volume characteristics shift, and price creates distinct formations that signal impending directional change. Traders who master pattern recognition gain a substantial advantage in timing entries and exits.
The forex market, with its high liquidity and continuous trading, provides ideal conditions for reversal pattern formation. Currency pairs frequently establish clear trends before reversing, creating numerous opportunities for pattern-based trading strategies. However, successful pattern trading requires more than simple recognition—it demands understanding of confirmation signals, volume analysis, and risk management principles.
Key Takeaways
- Reversal patterns indicate potential trend exhaustion and directional change, forming when market momentum shifts from buyers to sellers or vice versa
- Proper pattern confirmation requires volume analysis, breakout validation, and consideration of broader market context to avoid false signals
- Major reversal formations include head and shoulders, double and triple tops/bottoms, and wedge patterns, each with specific identification criteria and price targets
- Effective pattern trading combines technical recognition with disciplined risk management, including appropriate stop-loss placement and position sizing
- Volume typically expands during pattern completion and breakout phases, providing crucial confirmation of reversal validity and potential move strength
Understanding Technical Analysis Reversal Patterns
Technical analysis reversal patterns represent specific chart formations that develop when an existing trend loses momentum and prepares to change direction. These patterns materialize through a series of price movements that create recognizable geometric shapes on price charts. The formation process reflects the underlying shift in market sentiment as one group of market participants gains control from another.
The significance of reversal patterns extends beyond simple chart aesthetics. These formations encapsulate real market dynamics—the accumulation and distribution of positions, shifts in supply and demand balance, and changes in trader psychology. When a pattern completes, it provides insight into probable future price movement based on historical precedent and market mechanics.
Pattern development typically occurs over multiple trading sessions or weeks, depending on the timeframe analyzed. Longer timeframes generally produce more reliable signals, as they represent more significant shifts in market structure. However, patterns appear across all timeframes, from minute charts to monthly charts, each carrying weight proportional to its duration.
The Psychology Behind Reversal Patterns
Market reversals stem from fundamental changes in participant behavior. During an established uptrend, buyers maintain control, consistently pushing prices higher. Eventually, buying pressure weakens as participants who purchased earlier begin taking profits, while new buyers become reluctant to enter at elevated prices. This creates resistance where selling pressure matches or exceeds buying demand.
Similarly, downtrends reverse when selling exhaustion occurs. As prices decline, weak holders exit positions, but eventually, prices reach levels where value-oriented buyers enter aggressively. The resulting demand overwhelms remaining sellers, creating the foundation for a new uptrend.
Reversal patterns visualize this transition period. The price action within the pattern reflects the struggle between competing forces, with the eventual breakout indicating which side has gained control. Understanding this psychological foundation helps traders interpret patterns within proper context rather than mechanically following pattern rules.
Major Technical Analysis Reversal Patterns
Head and Shoulders Pattern
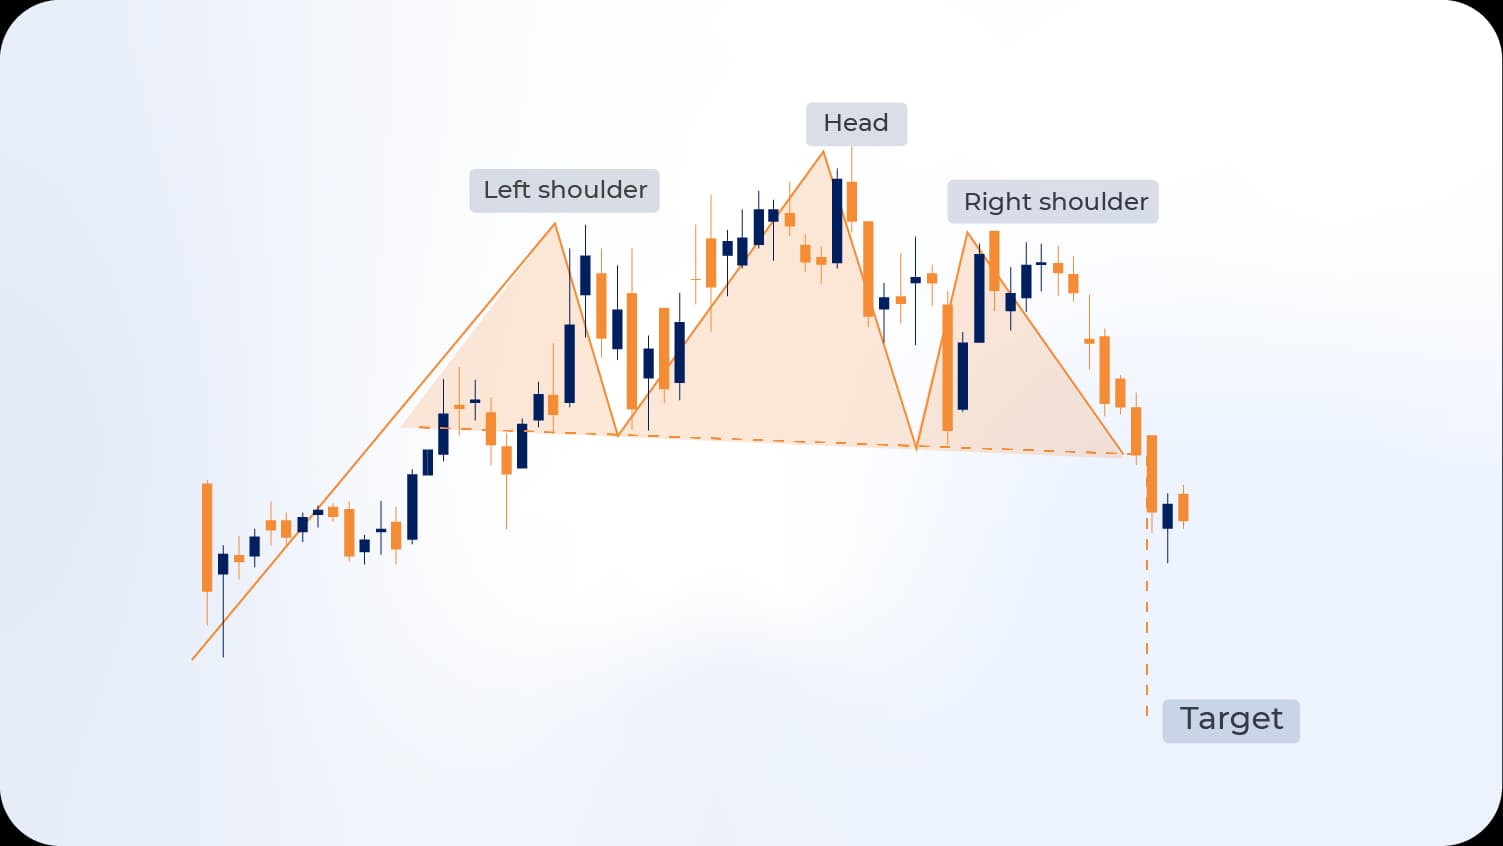
The head and shoulders pattern stands as one of the most reliable and widely recognized reversal formations in technical analysis. This pattern develops at trend tops and signals the transition from an uptrend to a downtrend. The formation consists of three distinct peaks: a left shoulder, a higher central peak (the head), and a right shoulder that forms at approximately the same height as the left shoulder.
The pattern's structure reveals crucial information about market dynamics. The left shoulder represents the final push higher within the existing uptrend, often accompanied by strong volume. The head forms as prices make a new high, but volume typically diminishes, indicating weakening momentum. The right shoulder develops when buyers attempt another rally, but prices fail to exceed the head's height, confirming loss of upward momentum.
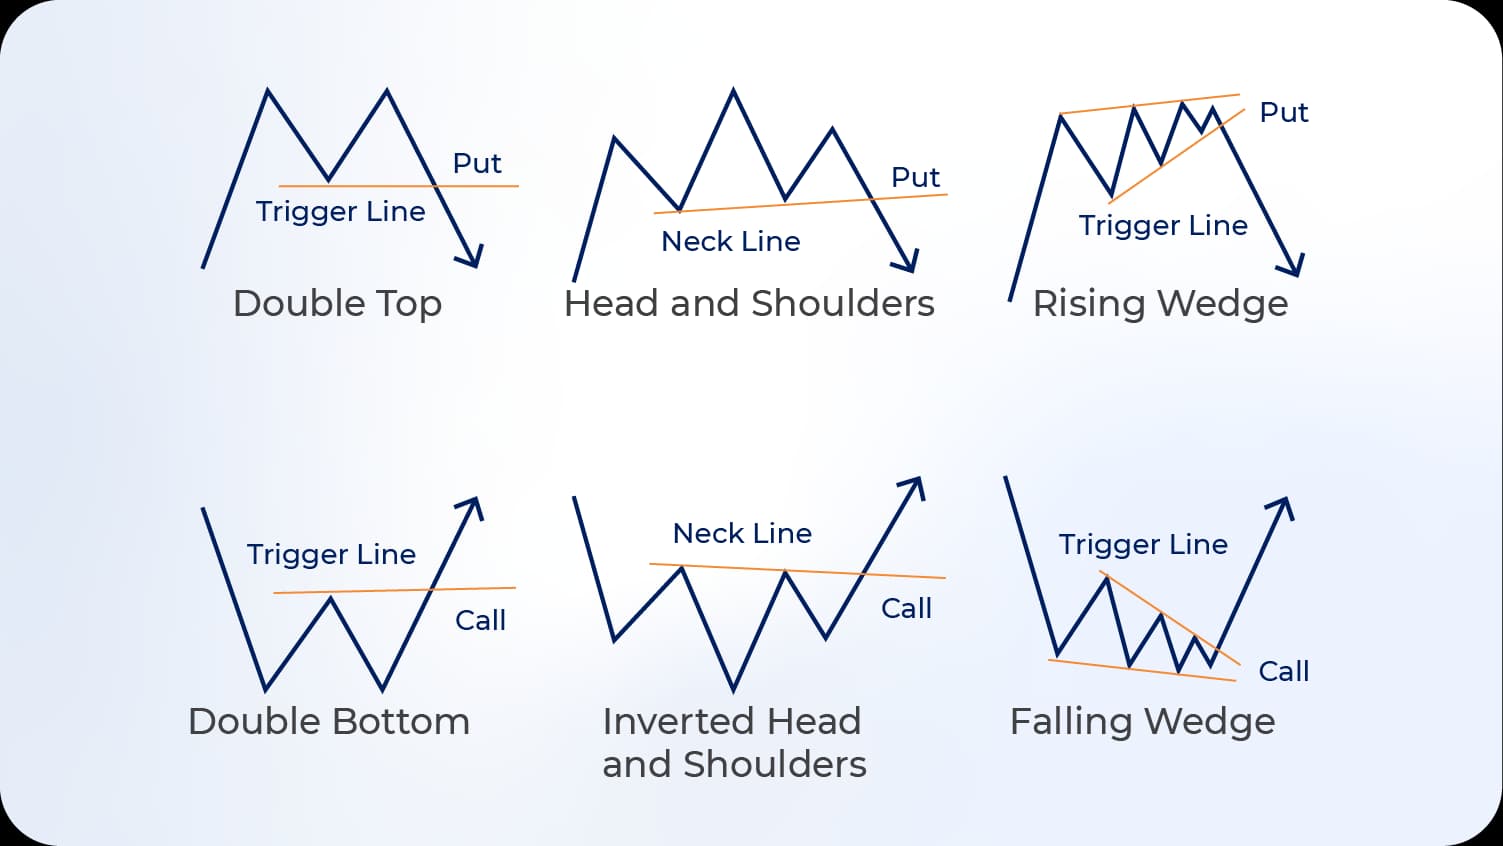
A horizontal line connecting the lows between the shoulders and head creates the neckline, a critical component for pattern confirmation. The pattern completes when prices break below the neckline, ideally accompanied by increased volume. This breakdown signals that sellers have overcome buyers, establishing downward momentum.
Price Target Calculation: The projected downward move equals the vertical distance from the head's peak to the neckline, measured from the breakout point. This measurement provides traders with a logical profit target based on the pattern's structure.
Inverse Head and Shoulders Pattern
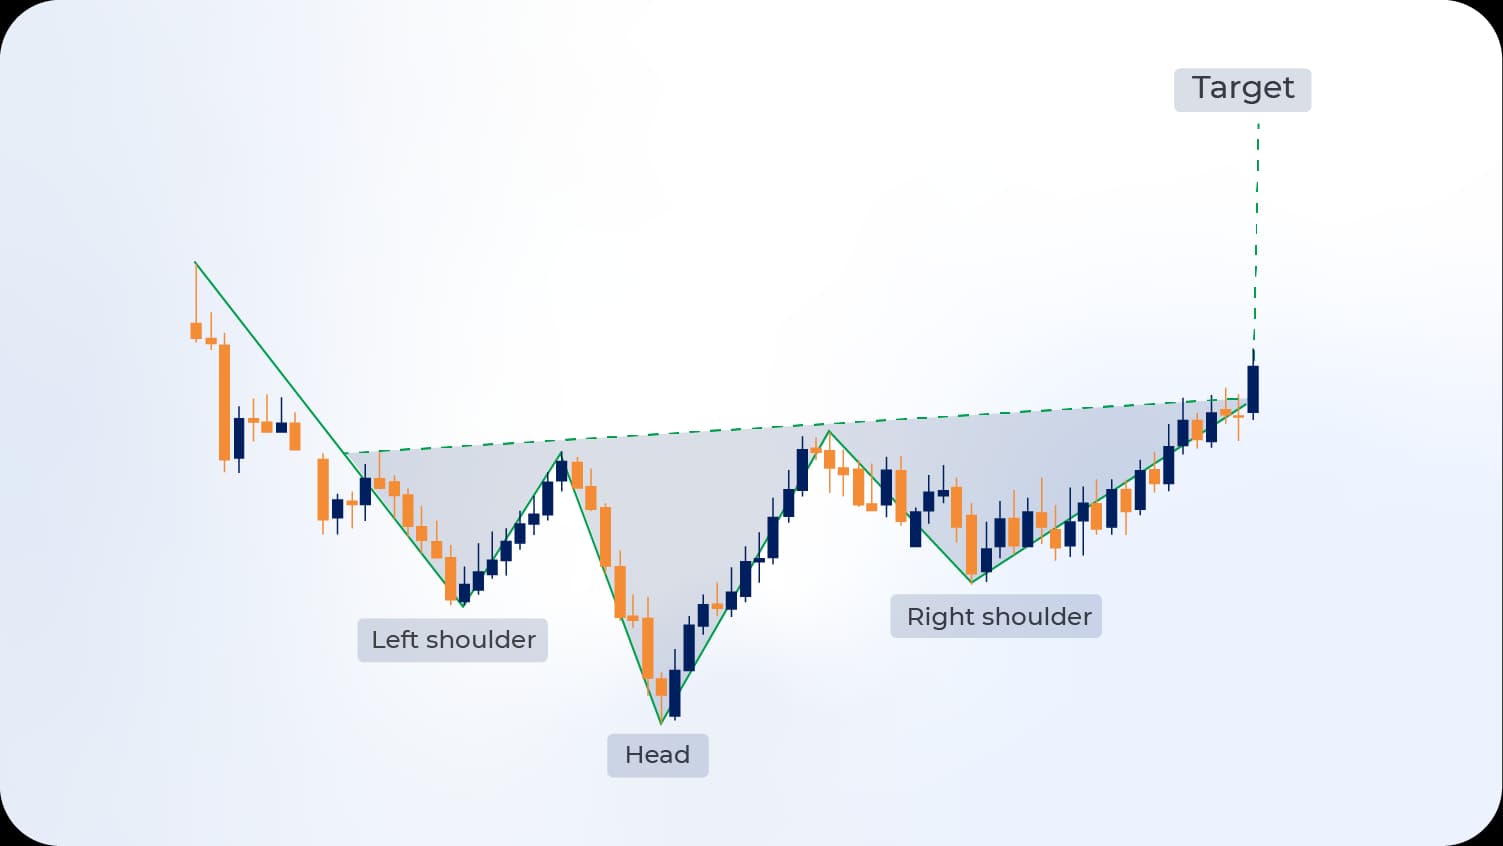
The inverse head and shoulders pattern mirrors its counterpart but forms at market bottoms, signaling reversal from downtrend to uptrend. This formation consists of three troughs: a left shoulder, a lower central trough (the head), and a right shoulder forming at approximately the left shoulder's depth.
Pattern development reflects the exhaustion of selling pressure. The left shoulder represents continued downward momentum within the established downtrend. The head forms as prices make a new low, but the subsequent rally shows increasing buying interest. The right shoulder develops when sellers attempt another push downward, but prices fail to reach the head's low, demonstrating weakening selling pressure.
The neckline connects the highs between the troughs, sloping upward as buyer strength increases. Pattern completion occurs when prices break above the neckline with expanding volume, confirming the shift from bearish to bullish control. The upward price target measures the distance from the head to the neckline, projected upward from the breakout point.
Double Top Pattern
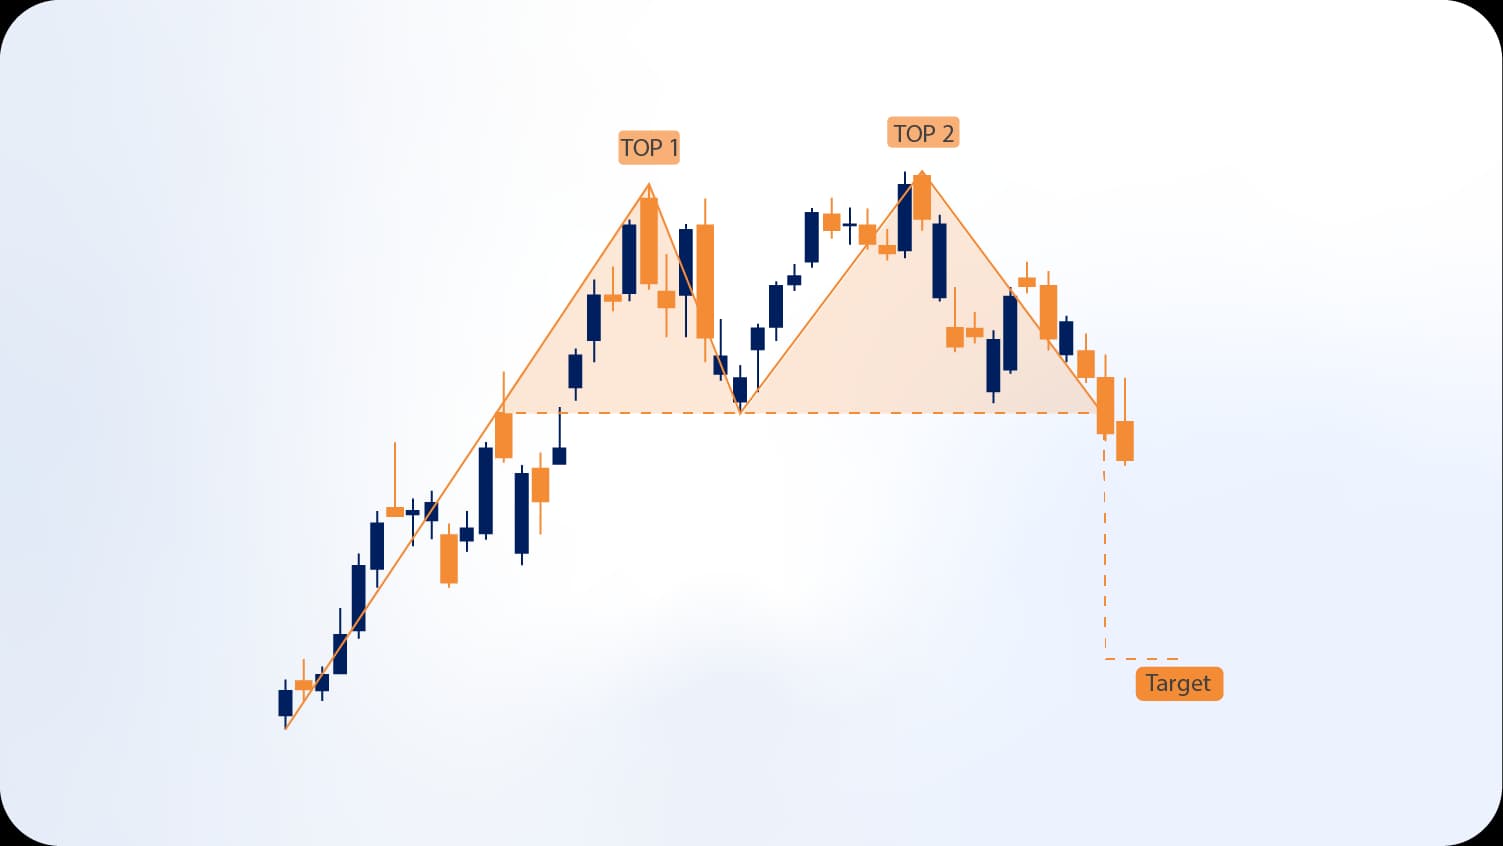
The double top pattern emerges after an extended uptrend, forming two distinct peaks at approximately the same price level. This formation indicates that prices have encountered significant resistance where sellers consistently overwhelm buyers. The pattern's simplicity makes it accessible to traders while maintaining reliable predictive value.
Pattern development begins when prices reach a peak and subsequently decline to form a trough. Buyers then push prices higher, attempting to extend the uptrend. However, when prices approach the previous peak, selling pressure intensifies, preventing new highs. This second peak confirms the resistance level's strength.
The trough between the peaks establishes the pattern's support level. When prices break below this support, the pattern completes, signaling a trend reversal. Volume analysis provides crucial confirmation—volume typically decreases during the second peak formation and expands during the breakdown, confirming authentic selling pressure.
Pattern Characteristics:
ComponentDescriptionSignificanceFirst PeakInitial resistance pointEstablishes ceiling levelTroughSupport between peaksBreakout trigger pointSecond PeakResistance confirmationValidates selling pressureBreakdownMove below trough supportPattern completion signal
The projected downward move equals the distance from the peaks to the trough, measured from the breakdown point. This target reflects the pattern's height and provides a rational profit objective.
Triple Top Pattern
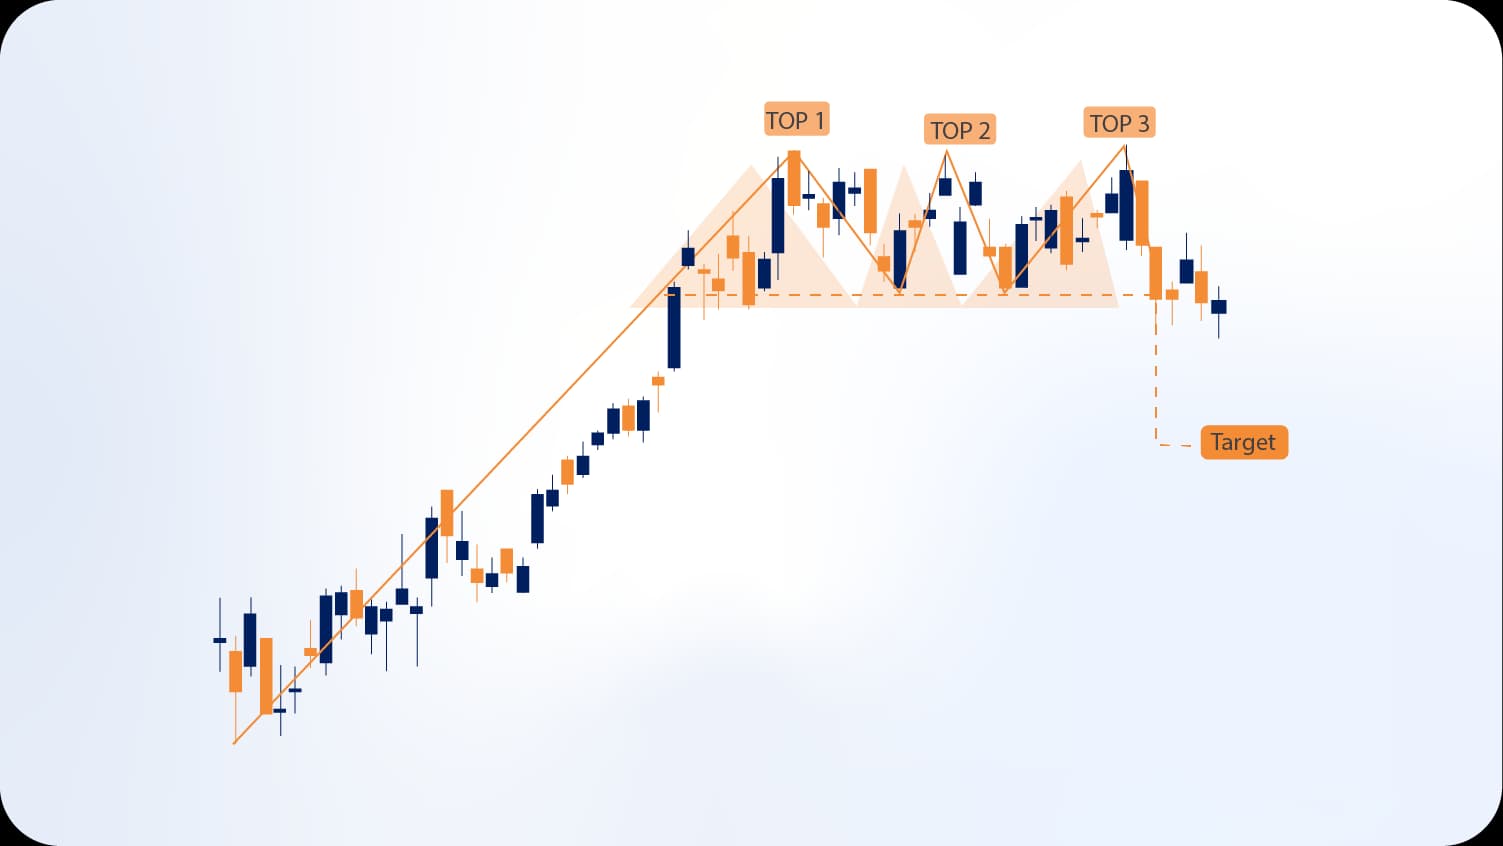
The triple top pattern extends the double top concept, featuring three peaks at approximately the same price level. This formation indicates exceptionally strong resistance where multiple rally attempts fail to break through. The pattern's rarity makes it particularly significant when it develops, suggesting robust selling pressure at the resistance level.
Each peak represents a distinct attempt by buyers to push prices higher, with subsequent failures demonstrating increasing seller dominance. The multiple tests of resistance exhaust buying momentum, creating conditions favorable for reversal. Volume typically declines with each successive peak, confirming weakening demand.
The support level connecting the lows between peaks serves as the critical breakdown point. When prices breach this support, preferably with increased volume, the pattern completes. The resulting downward move often proves substantial, as the extended consolidation period builds considerable energy for the subsequent trend.
Double Bottom Pattern
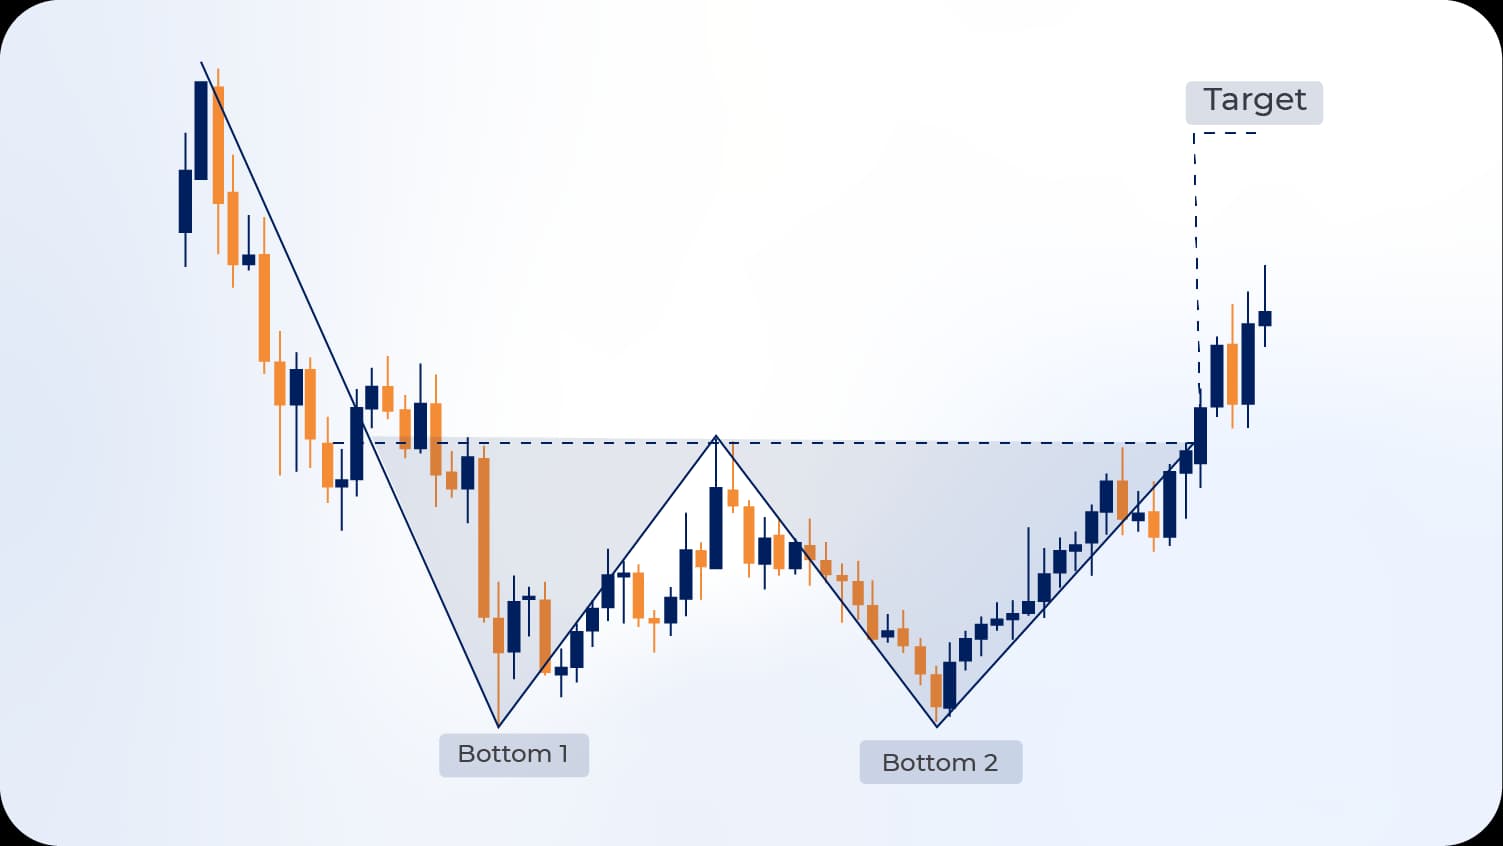
The double bottom pattern forms after a downtrend, creating two troughs at approximately the same price level. This formation signals that prices have found significant support where buyers consistently overwhelm sellers. The pattern indicates accumulation by value-oriented investors who recognize attractive pricing levels.
Pattern formation begins when prices decline to a low point and subsequently rally. After the rally exhausts itself, prices decline again, approaching the previous low. However, buying pressure emerges at this level, preventing new lows and creating the second bottom. This support confirmation signals potential trend reversal.
The peak between the two bottoms establishes the pattern's resistance level. When prices break above this resistance, the pattern completes, confirming the shift from downtrend to uptrend. Volume expansion during the breakout validates the pattern and suggests strong buying conviction.
According to market reversal analysis, recognizing these formations early provides traders with significant advantages in positioning for trend changes.
Triple Bottom Pattern
The triple bottom pattern features three troughs at approximately the same price level, indicating exceptionally strong support. This rare formation suggests multiple tests of support where buyers demonstrate consistent willingness to accumulate positions. The pattern's development reflects a gradual shift in market control from sellers to buyers.
Each trough represents a failed attempt by sellers to push prices lower. The repeated failures exhaust selling pressure while building buyer confidence. Volume characteristics typically show declining volume with each successive trough, indicating diminishing selling interest. When the breakout occurs above the resistance level connecting the peaks, volume should expand significantly, confirming authentic buying pressure.
The projected upward move equals the distance from the troughs to the resistance level, measured from the breakout point. Triple bottom patterns often precede substantial rallies, as the extended base-building period creates a stable foundation for sustained upward movement.

Rising Wedge Pattern
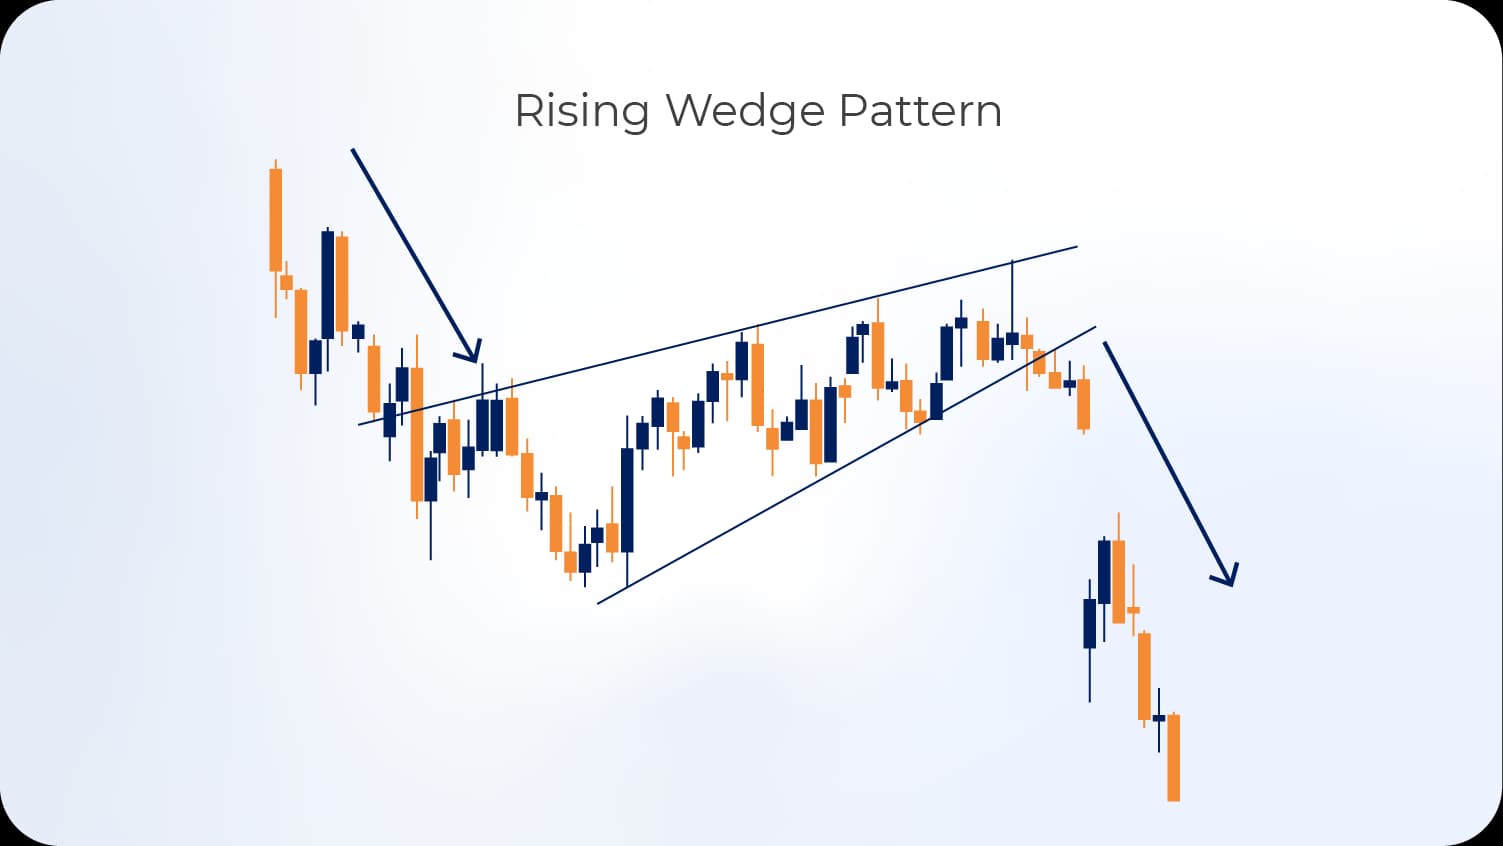
The rising wedge pattern develops when prices trend upward within converging trendlines, with both support and resistance lines sloping upward. However, the support line rises at a steeper angle than the resistance line, causing the pattern to narrow over time. Despite the upward price movement, this pattern actually signals bearish reversal, making it somewhat counterintuitive.
The pattern's bearish nature stems from weakening momentum despite higher prices. As the wedge develops, the angle of ascent decreases, and volume typically diminishes. These characteristics indicate that buyers struggle to maintain upward momentum, creating vulnerability to reversal.
Pattern completion occurs when prices break below the lower support trendline. This breakdown often happens suddenly and violently, as the wedge structure creates a coiled spring effect. The subsequent decline typically retraces a significant portion of the wedge's height, sometimes returning prices to the pattern's starting point.
Falling Wedge Pattern
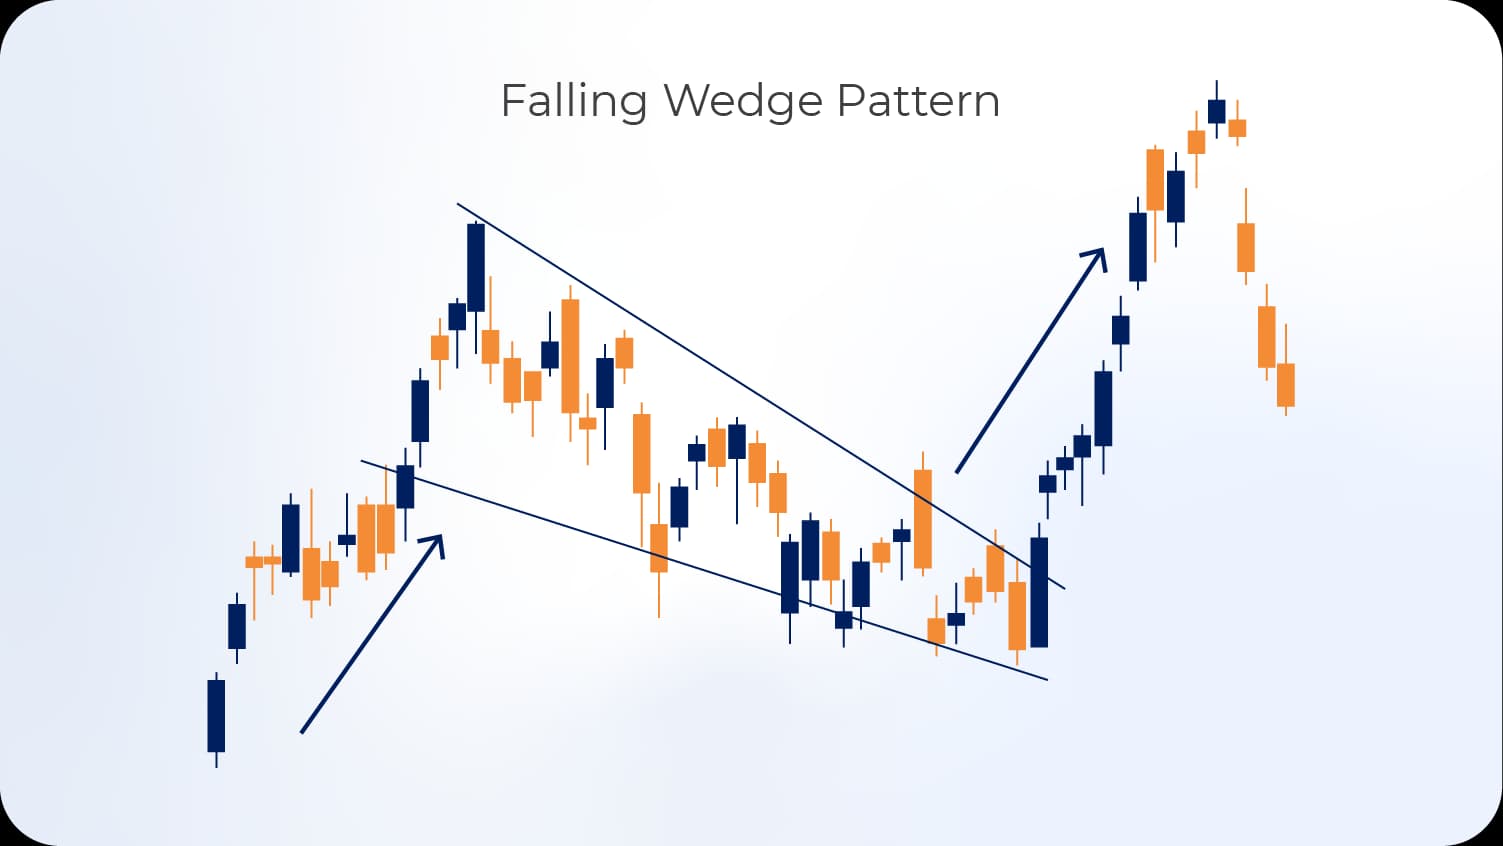
The falling wedge pattern forms when prices decline within converging trendlines, both sloping downward. The resistance line declines at a steeper angle than the support line, creating a narrowing formation. Despite the downward price action, this pattern signals bullish reversal.
The pattern's bullish implications derive from slowing downward momentum. As the wedge develops, the rate of decline decreases, and volume typically contracts. These characteristics suggest selling exhaustion and eventual reversal potential. The narrowing price range indicates that sellers struggle to push prices substantially lower, creating conditions for upward breakout.
Pattern completion occurs when prices break above the upper resistance trendline, preferably with expanding volume. The breakout often leads to substantial upward movement, as the wedge compression creates significant upward momentum once resistance breaks. The projected move typically equals at least the wedge's height at its widest point.
Pattern Confirmation and Validation
Recognizing pattern structure represents only the initial step in pattern-based trading. Proper confirmation separates reliable signals from false patterns that trap unprepared traders. Several criteria must align to validate pattern completion and increase probability of successful trades.
Volume Analysis
Volume provides crucial insight into pattern validity and breakout authenticity. During pattern formation, volume characteristics often reveal whether the pattern likely succeeds. Generally, volume should decrease as the pattern develops, reflecting diminishing participation from the trend that preceded the pattern. This volume contraction indicates that the previous trend's momentum has weakened.
During breakout, volume should expand significantly, demonstrating that new participants enter the market with conviction. High breakout volume confirms that the pattern has genuine market support rather than representing a temporary price fluctuation. Breakouts occurring on low volume frequently fail, as they lack the participation necessary to sustain the new trend.
The volume relationship between pattern development and breakout provides a reliable confirmation filter. Traders should exercise caution with patterns where breakout volume fails to exceed average volume substantially, as these situations increase failure probability.
Read More: What Is Volume Analysis?
Breakout Confirmation
Price action following the initial breakout provides additional confirmation. Legitimate breakouts typically show sustained movement in the breakout direction without immediate return to the pattern boundaries. Many traders employ specific confirmation criteria, such as requiring prices to close beyond the breakout point for a certain number of periods or move a minimum percentage beyond the breakout level.
The throwback or pullback concept further validates breakouts. After breaking through pattern boundaries, prices frequently return to test the broken level from the opposite side. For example, after breaking above resistance, prices may pull back to test that level as new support. When this test holds, it provides strong confirmation that the breakout represents genuine reversal rather than false signal.
Multiple Timeframe Analysis
Examining patterns across multiple timeframes enhances confirmation reliability. A reversal pattern appearing on daily charts gains credibility when the weekly chart shows complementary structure. Conversely, a daily chart pattern that contradicts longer-term trend structure carries higher failure risk.
This multi-timeframe approach provides context for pattern significance. Large patterns on weekly or monthly charts typically produce more substantial moves than small patterns on intraday charts. Aligning pattern analysis with higher timeframe structure increases success probability by ensuring trades flow with dominant market forces.
Read More: Forex Timeframe Mastery: Strategies for Every Trader Level
Trading Strategies Using Reversal Patterns
Entry Timing
Pattern-based trading offers multiple entry approaches, each with distinct risk-reward characteristics. Conservative traders enter positions only after full pattern confirmation, waiting for breakout completion and initial confirmation period. This approach reduces false signal risk but may sacrifice some profit potential as entry occurs after initial movement.
Aggressive traders sometimes enter positions during pattern development, anticipating completion. This approach offers superior risk-reward ratios, as entry occurs at more favorable prices. However, it carries increased risk, as the pattern may fail to complete. Partial position entry strategies balance these considerations, establishing initial positions during development and adding to positions upon confirmation.
Entry Strategy Comparison:
StrategyEntry PointRisk LevelPotential RewardConservativeAfter breakout confirmationLowerModerateModerateAt breakoutModerateGoodAggressiveDuring pattern formationHigherExcellent
Stop-Loss Placement
Effective risk management requires appropriate stop-loss placement based on pattern structure. For completed patterns, stops typically sit just beyond the pattern boundary opposite the breakout direction. For head and shoulders patterns, stops sit just above the right shoulder or head. For double bottoms, stops sit just below the bottoms.
This placement protects against pattern failure while allowing normal price fluctuation. The stop distance should reflect the pattern's size and market volatility. Larger patterns warrant wider stops, while smaller patterns or less volatile markets allow tighter stops.
Traders must balance protection against premature stop-outs with limitation of potential losses. Stops placed too tightly result in frequent premature exits from positions that ultimately succeed. Stops placed too widely expose traders to excessive losses when patterns fail.
Profit Targets
Reversal patterns provide objective profit targets based on pattern measurements. The standard target equals the pattern's height projected from the breakout point. This measured move represents the minimum expected movement based on historical pattern behavior and mathematical relationships.
However, traders should consider additional factors when establishing profit targets. Nearby support or resistance levels may impede price progress, warranting earlier exits. Previous swing highs or lows, moving averages, and Fibonacci levels all represent potential obstacles that may prevent prices from reaching full pattern targets.
Partial profit-taking strategies allow traders to secure gains while maintaining exposure to potentially larger moves. Taking partial profits at key levels and trailing stops on remaining positions balances certainty of some profit against possibility of superior returns.
Common Mistakes in Pattern Trading
Premature Pattern Recognition
Traders frequently identify patterns before they fully develop, leading to premature entries and losses. Pattern completion requires specific criteria, and trading incomplete patterns substantially increases failure probability. The eagerness to capture reversals sometimes clouds judgment, causing traders to see patterns where none exist or to anticipate completion prematurely.
This mistake particularly affects new traders who lack experience with pattern nuances. Development of pattern recognition skills requires studying numerous examples and understanding subtle differences between valid and invalid formations. Patience in waiting for clear pattern completion significantly improves trading outcomes.
Ignoring Market Context
Reversal patterns do not operate in isolation. The broader market context profoundly influences pattern success rates. A bullish reversal pattern at major resistance in a strong downtrend carries different implications than the same pattern at support in an uptrend. Traders must consider the position within the larger trend structure, proximity to significant support and resistance, and overall market conditions.
Additionally, fundamental factors sometimes override technical patterns. Major economic events, central bank decisions, or geopolitical developments can invalidate technical signals. Awareness of scheduled events and their potential impact helps traders avoid situations where technical patterns conflict with fundamental drivers.
Neglecting Risk Management
Even the most reliable patterns fail occasionally. Traders who neglect proper risk management eventually experience significant losses when a series of patterns fails. Each trade should risk only a small percentage of trading capital, typically 1-2% per position. This approach ensures that even consecutive losses do not significantly impair trading capital.
Position sizing must reflect both stop-loss distance and account size. Larger stops require smaller position sizes to maintain consistent risk levels. Traders who fail to adjust position sizes properly often take excessive risk on trades with wider stops, leading to catastrophic losses when these positions fail.
Advanced Pattern Trading Concepts
Pattern Combinations
Markets sometimes form multiple patterns simultaneously or in sequence, creating powerful trading opportunities. A head and shoulders pattern within a larger wedge formation provides multiple confirmation signals. Similarly, a double bottom at major support after an extended downtrend carries greater significance than an isolated double bottom.
Recognizing pattern combinations requires experience and careful chart analysis. These complex formations often precede major trend changes, as they represent extended periods of accumulation or distribution. Traders who identify these situations gain significant advantages through superior positioning.
Failed Patterns and Reversal Trading
Pattern failures provide trading opportunities for experienced traders. When a pattern breaks in the expected direction but quickly reverses, it often triggers stop-losses from traders positioned for pattern success. This creates momentum in the opposite direction, sometimes producing larger moves than successful patterns.
Failed head and shoulders patterns, for example, often precede strong trend continuation when prices break above the right shoulder. Similarly, failed double bottoms that break below support sometimes lead to accelerated declines. Trading failed patterns requires quick recognition and decisive action, as these moves develop rapidly.
Pattern Reliability Across Different Markets
Pattern effectiveness varies across different currency pairs and market conditions. Major pairs with high liquidity typically produce more reliable patterns than exotic pairs with lower trading volume. Additionally, patterns in trending markets generally show higher success rates than patterns during ranging conditions.
Traders should track pattern performance in their specific markets and maintain statistics on success rates. This empirical approach identifies which patterns work best in particular contexts, allowing traders to focus on highest-probability opportunities.
Frequently Asked Questions
What are the most reliable reversal patterns in technical analysis?
The head and shoulders pattern and its inverse demonstrate the highest reliability among reversal formations when properly confirmed. Studies across various markets show success rates exceeding 70% when these patterns include proper volume confirmation and develop over appropriate timeframes. Double tops and bottoms also provide reliable signals, particularly when forming at significant support or resistance levels. Pattern reliability increases substantially when multiple confirmation factors align, including volume expansion on breakout, appropriate pattern proportions, and consistency with longer-term market structure.
How can traders distinguish between reversal patterns and continuation patterns?
Reversal patterns form after established trends and signal directional change, while continuation patterns develop during trends and signal resumption after consolidation. Structural differences help identification—reversal patterns typically show symmetry and clear boundary violations, while continuation patterns show directional bias matching the preceding trend. Context provides crucial distinction, as patterns appearing at trend extremes more likely signal reversal, while patterns mid-trend typically indicate continuation. Volume characteristics also differ, with reversal patterns often showing distinctive volume patterns during formation and breakout phases compared to continuation patterns.
What timeframes work best for trading reversal patterns?
Daily and weekly charts generally provide the most reliable reversal pattern signals, as they represent substantial market structure shifts. These timeframes filter market noise and produce patterns with greater predictive value. However, pattern principles apply across all timeframes, and traders should select timeframes matching their trading style and time availability. Shorter timeframes produce more frequent signals but lower reliability, while longer timeframes offer superior reliability but fewer opportunities. Multiple timeframe analysis, examining patterns on both trading timeframe and longer timeframes, produces optimal results.
How do volume characteristics affect pattern validity?
Volume provides critical confirmation of pattern authenticity and breakout strength. During pattern formation, declining volume typically indicates weakening trend momentum and increases pattern validity. During breakout, expanding volume confirms genuine market participation and suggests higher success probability. Patterns developing with unusual volume characteristics, such as high volume during formation or low volume during breakout, show increased failure rates. Volume analysis should consider both absolute levels and relative changes from average volume, with particular attention to volume during critical pattern stages like neckline breaks or support violations.
Can reversal patterns fail, and how should traders manage this risk?
All reversal patterns carry failure risk, typically ranging from 20% to 40% depending on pattern type and market conditions. Effective risk management requires appropriate stop-loss placement, position sizing, and acceptance of occasional losses as normal trading costs. Traders should place stops beyond pattern boundaries that would invalidate the formation, exit positions promptly when patterns fail, and maintain discipline in risk management regardless of pattern confidence. Position size should limit potential loss to acceptable levels, typically 1-2% of trading capital per trade. Pattern failure sometimes provides trading opportunities in the opposite direction when recognized quickly.
What role does market psychology play in reversal pattern formation?
Reversal patterns visually represent the psychological transition between market phases. During pattern formation, the balance shifts from one dominant group to another—from buyers to sellers at tops, or sellers to buyers at bottoms. Each pattern component reflects specific psychological states: denial during initial price rejection, hope during consolidation, and capitulation during breakout. Understanding this psychology helps traders interpret patterns within proper context and anticipate likely outcomes. Pattern shapes emerge from collective behavior of thousands of participants, creating recurring formations that technical analysis identifies and exploits.
How should traders combine reversal patterns with other technical indicators?
Effective trading strategies integrate pattern analysis with complementary technical tools. Oscillators like RSI or stochastic indicators confirm divergence at pattern peaks or troughs, strengthening reversal signals. Moving averages provide context about trend strength and potential support or resistance levels. Fibonacci retracements identify logical price targets and pattern boundaries. Volume indicators validate pattern authenticity. However, traders should avoid overcomplicated systems with excessive indicators, as this often produces conflicting signals. A focused approach combining pattern recognition with 2-3 complementary indicators typically produces superior results to complex systems with numerous technical tools.
Conclusion
Technical analysis reversal patterns represent essential tools for traders seeking to identify trend changes and capitalize on significant market movements. These formations emerge from fundamental market dynamics, reflecting shifts in supply and demand balance and changes in participant psychology. Mastery of pattern recognition, confirmation techniques, and proper trading implementation provides substantial advantages in navigating forex markets.
Success in pattern-based trading requires more than memorizing pattern shapes. Traders must understand the market psychology behind pattern formation, apply rigorous confirmation criteria, and implement disciplined risk management. The patterns discussed, including head and shoulders, double and triple tops and bottoms, and rising and falling wedges, provide a comprehensive framework for identifying reversal opportunities in a wide range of market conditions.
The integration of volume analysis, multiple timeframe consideration, and awareness of market context separates successful pattern traders from those who struggle. While no pattern guarantees success, proper application of these principles significantly improves trading outcomes. Traders should focus on quality over quantity, waiting for clear, well-confirmed patterns rather than forcing trades on marginal formations.
Continuous learning and adaptation remain crucial, as market conditions evolve and pattern effectiveness varies across different environments. Maintaining detailed records of pattern trades, analyzing both successes and failures, and refining approaches based on empirical results leads to steady improvement. The journey to pattern trading mastery requires patience, discipline, and commitment to ongoing education.
